Download
1 / 29
290 likes | 502 Views
Application of Hyperspectral Data. Bio-sciences Lammert Kooistra and Michael Schaepman Wageningen University. Introduction. Introduction.

E N D
Application of Hyperspectral Data Bio-sciences Lammert Kooistra and Michael Schaepman Wageningen University
Introduction • Bio-science applications originating from imaging spectrometer data products are in most cases indirectly derived and require the use of ‘models’ (e.g., radiances – PRI – LUE – DVM – Biodiversity). • Directly derived bio-science applications from imaging spectrometer data are sparse (e.g., LUCC) or often site specific. • Wageningen UR (CGI) is currently focusing on the integration of imaging spectrometer data derived products into dynamic vegetation models.
Applications I • Variables • Mostly being used as input for a model that needs to produce a spatially explicit output • Parameters • Mostly being used to constrain a model or other parameters (not too much relevance for the bio-domain) • Applications • Higher level product the involves the use of {statistical, physical} models • Products • Can be any of the above
Applications II • Relevant Bio-Science Variables • At-sensor radiance • Surface reflectance • (Spectral) Albedo • fAPAR • fCover / gap fraction • LAI • Leaf/canopy pigments (Chlorophyll, Xantophyll, Cellulose, etc.) • Leaf/canopy water • Leaf/canopy dry matter • Foliage temperature • Soil temperature • fLiving/fDead biomass (litter) / SOC
Applications III • Relevant Bio-Science Products • Albedo • Efficiency (Light Use, Water Use, Rain Use) • LUCC, VCC • GPP, aNPP, NPP • Biodiversity • Ecosystem, habitat, species distribution • Crop growth and yield estimation • Plant stress (nitrogen; water) • Forest inventories (e.g., forest area, forest type, fragmentation, biomass, stem volume, crown diameter) • Carbon sequestration (reforestation, afforestation, deforestation) • Ecosystem resilience • Ecosystem services • Fire (health, water stress, fuel type, activation energy)
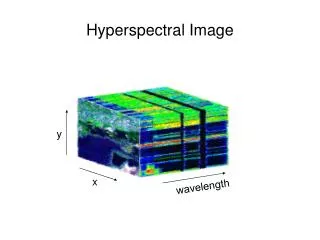
Application IV • Imaging spectroscopy measures radiance (with spatial (2D), spectral, temporal, directional (2D), and polarization dependencies) • However the reflectance of a canopy is a function of its geometry, structure, biochemistry, and geochemistry. • We employ mainly quantitative statistical or physical models (or a combination of both) to bridge the gap that imaging spectroscopy cannot measure any of the canopy parameters directly (sometimes this is (erroneously) referred to as being the ill-posed problem)
MJm-2day-1 Example I fAPAR ANPP (LUE approach) PRI Regional estimates of aboveground Net Primary Productivity (aNPP) for a river floodplain Issues: • Regional scale ecosystem modeling • DVM initialisation, calibration and validation • Scenario development including human impact Aduaka, U. et al., 2006
Spatial abundance map for Rubus caesius based on combined approach of SMA and radiative transfer modelling Example II Species abundance maps fAPAR PRI PFT2: mixed herb PFT1: Grazed Grassland • Issues: • Level of detail increases with increasing spatial resolution • Many RTM’s are sensitive to the shadow fraction • Parameterizations of models need to account horizontal competition Liras, E. et al., 2005
Example III Field / Laboratory Observations Radiative Transfer Modelling (DART) v = 48° v = 225° RGB = NIR,G,B OFF-NADIR simulated forest stand Laboratory measurement of the needle optical properties RGB = NIR,G,B Spatial (3D) measurement of the tree structural parameters DART 3D spruce „mock-up“ NADIR simulated forest Malenovsky, Z. et al., 2006
Example IV Three Gorges Region,China EO-1 Hyperion data • Issues: • Bridging scaling gaps from local to regional • Combined physical and statistical model calibration • Assessing ecosystem services Zheng, Y. et al., 2006
Example V l h Acerbi, F. et al., 2006
Example VI Sub-pixel Land Cover mapping with MERIS Identification of endmembers Reference dataset (LGN) Sub-pixel accuracy • Issues: • Requirement to map LUCC at high spatial resolution • Vegetation Cover Conversion (state vectors) • Phenology Zurita-Milla, R. et al., 2006
Developments I • Bridging scaling gaps will be come more relevant (genetics – molecules – leaves – plants – canopies – ecosystems)
Developments II • In-situ networks (SensorWeb), data assimilation and applied optimal estimation methods will further constrain degrees of freedom
Developments III • In coupled human-environment systems monitoring of transitional zones (ecotones – habitat, ecosystem boundaries) deserve more attention
Developments IV • Holistic views striving to describe the Earth System better in all relevant aspects will result in more detailed spectroscopic analysis
Developments V • 3-D radiative transfer approaches in partly cloudy atmospheres
Developments VI • Biochemical applications concentrate on the retrieval of moisture content, C, N, and (potentially) P cycles
Developments VII • Coupled systems (soil-vegetation-atmosphere transfer (SVAT)) must emphasize on the soil component
Discussion Points • Imaging spectroscopy of vegetation is one of the most challenging applications in remote sensing due to the multitude of simultaneously influencing factors and that none of the measurements is a direct measurement • Semantic interoperability is the (unexplored) link between remote sensing and vegetation research (PFT, Albedo, reflectance, etc.) • In characterizing the SVAT (soil-vegetation-atmosphere-transfer) scheme, the S remains the least explored so far (no parametric soil model avaiable)
Discussion Points • Spectral band redundancy discussions should be replaced with full spectral coverage discussions, making use of the contiguity criterion of spectral measurements • Spectroscopy has most significantly advanced the understanding of interactions of photons with vegetation. We are looking forward for photon-matter interactions. • Spectroscopy alone will not be able to solve current issues to the full extend: we need phenology (time series), ground measurements (data assimilation), and other technologies (fluorescence, SAR, LIDAR, etc.) to complement spectroscopy