Hospital Outcomes Reports using Administrative Data
390 likes | 571 Views
Hospital Outcomes Reports using Administrative Data . Presenter: Brian Paciotti, PhD. Main Points. Measuring healthcare quality Summary of administrative data reports Risk-adjustment and quality ratings Hospital comment letters Adding laboratory values to the discharge data

Hospital Outcomes Reports using Administrative Data
E N D
Presentation Transcript
Hospital Outcomes Reports using Administrative Data Presenter: Brian Paciotti, PhD
Main Points • Measuring healthcare quality • Summary of administrative data reports • Risk-adjustment and quality ratings • Hospital comment letters • Adding laboratory values to the discharge data • Challenges of public reporting
Healthcare Quality Robert Brook, Elizabeth McGlynn, and Paul Shekelle (2000) Defining and Measuring Quality of Care: A Perspective from US Researchers “In the last 30 years, research has demonstrated that 1) quality can be measured, 2) that quality varies enormously, 3) that where you go for care affects its quality far more than who you are, and 4) that improving quality of care, while possible, is difficult and painful.”
Organizational Factors and Clinical Processes Influence Patient Outcomes Organizational factors (e.g., nursing ratios, hospital size) Patient Outcomes (e.g., 30-day mortality, hospital readmission, complications) Clinical Processes (e.g., tests performed, beta-blockers)
Public Reporting of Healthcare Outcomes • Two pathways for improvement. Public reporting: • Motivates internal quality improvement • Steers patients and payers towards high performing hospitals or surgeons • Evidence suggests that public reporting of outcomes is effective
Administrative Data Reports • Heart Attack: 1992-94, 1994-96, 1996-98 • Community-Acquired Pneumonia: 1999-2001, 2002-2004, 2003-2005 • Agency for Healthcare Research and Quality (AHRQ) Inpatient Mortality Indicators: 2006-2007 • AHRQ volume and utilization indicators: 2005-2007 • Studies in preparation • Maternal Outcomes • Congestive Heart Failure • Abdominal Aortic Aneurysm (AAA) Repair • Hip Fracture • Stroke Outcomes
Risk-Adjustment and Quality Ratings • Hospital-level risk-adjusted death rate (RADR) • Apply regression coefficients to patient data to obtain expected number of deaths for each hospital • RADR = observed death rate * statewide death rate expected death rate • Confidence Intervals – 98% • Low volume hospitals generally will have wider confidence intervals • Quality rating: • “Better” = RADR < state rate • “Worse” = RADR > state rate
Working with the Hospitals: Comment Letters Pneumonia report: • “We believe strongly that the Community-Acquired outcomes report does not reflect the reality of hospital quality care, nor the true risk of death following community-acquired pneumonia because of inaccuracies in data on the source of admission. “ AHRQ Inpatient Mortality Indicators: • “The data does not appear to be adjusted for multiple co-morbid conditions that could contribute to death of an inpatient and does not account for a patient who has determined they do not want to be resuscitated if their condition deteriorates while in the hospital.
Improving Administrative Data • Administrative data are created for billing, not predicting mortality • Administrative data is improved substantially with “Present-on-Admission” (POA) fields • Reward hospitals for sicker patients, not for making them sick • Important that hospitals code POA accurately • In 2011, OSHPD will add laboratory values to the patient discharge data • In combination with POA fields, hybrid dataset will come closer to the clinical data “gold standard”
Data Elements: Final List Lab Values AST Potassium Sodium pH PT/INR Albumin Creatinine BUN Platelets White Blood Cells Hematocrit/Hemoglobin Vital Signs Oxygen Saturation Pulse Blood Pressure Respiration Rate Temperature Operating Physician ID Patient Address Items in bold have been approved for the final list
Challenges • Poor quality data can impact hospital ratings (validation is effective, but resource intensive) • 30-day mortality is a better measure than in-hospital mortality (hospital discharge practices may vary), but there is a delay in obtaining vital statistics data • Risk-adjustment allows fair comparisons between hospitals, but the process can be time consuming • Clinical consultation and literature review • Risk-factor data validation • Technical Advisory Committee consensus
Challenges, cont. • How do we present statistical results? • Consumers prefer simple reports • Providers want to illustrate the uncertainty of the results • Stakeholders have different perspectives • Perfection is the enemy of the good • Do not risk our reputation with unreliable or invalid reports
Questions? • Contact Information Brian Paciotti, PhD Healthcare Outcomes Center Research Scientist 916-326-3864 bpaciott@oshpd.ca.gov www.oshpd.ca.gov
Evaluating Hospital and Physician Outcomes Using Clinical Data Presenter Joseph Parker, PhD
Clinical Data Outcomes Reports • Why use clinical registry data? • Greater acceptance (face validity) by providers • It is the language of treatment (not ICD codes) • Used in hospital quality improvement activities • Collected from clinical unit at hospitals • Superior for risk modeling • Viewed as essential for physician-level quality reporting • What topics? • Intensive Care Outcomes • Coronary Artery Bypass Graft Surgery (CABG)
Clinical Data Outcomes Reports • Intensive Care Unit (ICU) Outcomes • Voluntary program began 1999 – OSHPD contract with UCSF (33 hospitals) • Studied feasibility of public reporting ICU mortality rates at California hospitals • Participating hospitals collected extensive clinical data on a subset of their adult ICU patients • Products: • Feedback on data quality and processes of care to participants • Risk-adjusted mortality rates calculated & shared • Two reports with blinded hospital information • Hospital ICU outcomes currently reported by California Hospital Assessment and Reporting Taskforce (CHART): Approx. 200 hospitals
Clinical Data Outcomes Reports • Coronary Artery Bypass Graft Surgery (CABG) Outcomes … and more • Why CABG? • CABG is one of the most expensive hospital surgeries • In early 2000s ranked among the top 10 major procedures for volume and rate of mortality • History of public reporting (New York, 1989) • Key Dates • Voluntary program – 1996 (1st public report July, 2001) • Legislation - 2001 • Mandatory program - 2003
California CABG Mortality Reporting Program (CCMRP) Voluntary statewide reporting system was established in 1996 Public/private sector partnership between OSHPD and the Pacific Business Group on Health Based on Society of Thoracic Surgeons (STS) database Outcome measure: in-hospital mortality for isolated CABG Risk-adjustment for differences in patient case mix Three reports were produced: 1997-1998, 1999, 2000-2002
CCMRP: Limitations • Voluntary participation (approx. 70% of hospitals) • Lack of data on non-participants • Relationship between participation status and outcomes • Hospitals allowed to withdraw after seeing preliminary results • Stakeholder Insistence on statewide reporting • Consumer choice • Healthcare purchasing (businesses, health plans) • Quality improvement by physicians and hospitals
Legislation: Senate Bill 680 (2001) Created mandatory data reporting program, California CABG Outcomes Reporting Program (CCORP) for all California licensed hospitals that perform heart bypass surgery • Risk-adjusted results to be reported by hospital (every year) and by surgeon (every two years) • Hospital and surgeon review process • Surgeon statement submission (appeals) process • Created 9-member Clinical Advisory Panel (CAP) • Periodic hospital data audits
Coronary CABG Outcomes Reporting Program (CCORP) First year of data collection 2003 Data collected on ALL CABG surgeries, but performance reporting only on isolated CABG Hospital data certification by CEO/administrator or designee Surgeon certification upon data submission Hospital penalty for late filings Data quality activities
Ensuring Data Quality and Integrity • Hospital data abstractor training • Clinical consultation on coding issues • Expert cardiologist, Clinical Panel, UC Davis Contract • CCORP data collection tool provided free • Automated data edits, quality comparison reports, and requests for supporting documentation • Linkages to Patient Discharge Data and Death File • Yearly hospital medical chart audits • Surgeon “appeals” process
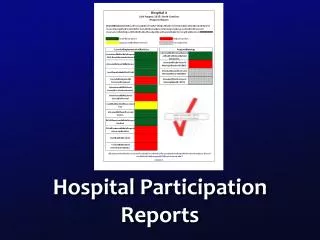
Hospital Medical Chart Audits • Audit Sample • Preliminary hospital and surgeon outliers • Near hospital and surgeon outliers • Hospitals with probable over-reporting or under-reporting of risk factors • Hospitals from a random pool • Number of records proportional to hospital size • All deaths and highest-risk patients • Blinded on-site audits • Detailed audit results provided to hospitals to improve coding • Audit data replaces submitted data
Preliminary Results • Hospitals (60 day review) • Preliminary risk-adjusted mortality rates for all hospitals • Performance ratings – worse-, better-, or not different- than state average • Instructions on how to submit a comment letter for final report • Surgeons (30 days to appeal) • Preliminary risk-adjusted results for that surgeon • Performance rating – worse-, better-, or not different- than state average • Instructions on how to appeal if “results do not accurately reflect the quality of care provided”
Surgeon “Appeal” Process • Surgeons submit statements • OSHPD reviews statements and agrees or disagrees with surgeon request • Surgeons not satisfied with OSHPD decision may forward statement to Clinical Advisory Panel for review • Panel will: • Uphold the CCORP decision OR • Reach one of the other conclusions set forth by the law • Flaw in the risk model so report is flawed • Flaw in surgeon data so corrections required • Panel’s determination is final
Surgeon Statement Process • 2003-2004 Report • 31 Statements - 15 forwarded to Panel • Panel did not agree with OSHPD on 8 cases, allowed resubmission of data for 6 • 3 surgeons’ performance ratings changed as a result of review process • 2005-2006 Report • 11 Statements – 5 forwarded to Panel • Panel concurred with OSHPD on all but one statement • Issues • Assignment of responsibility • Very high-risk patients (risk model inadequate) • Non-isolated vs. isolated CABG procedure
CCORP Reports • Three prior reports: 2003, 2003-2004, 2005
Report Contents • Risk Model • Risk-adjusted operative* mortality rates and performance ratings for hospitals and surgeons on isolated CABG surgeries • Performance ratings – hospitals and surgeons rated as worse than, better than, or same as state average • Hospital performance ratings for use of the Internal Mammary Artery (the preferred artery for bypass) • Only low (poor) users given performance rating • Hospital/Surgeon volume and outcomes associations • Hospital comment letters * Operative mortality: death occurring in the hospital after surgery, regardless of length of stay, or death occurring anywhere after discharge, but within 30 days of CABG surgery
Impact of CABG Report • Hospitals have instituted internal quality improvements • Reported changes in hospital contracting/referrals • Surgeons involved in the data quality review • In-hospital and operative mortality rates have declined (36% decline in in-hospital mortality since start of mandatory program) • UC Davis preliminary report on “Impact of Mandatory Public Reporting” • Marked and sustained drop in observed and risk-adjusted operative mortality • Lower volume across hospitals and surgeons • No detectable avoidance of high-risk patients
Volume of Isolated CABG, Non-Isolated CABG, and PCI Surgery in California 1997-2007
In-Hospital Mortality Rates for Isolated, Non-Isolated CABG, and PCI Surgery in California 1997-2007
Unadjusted Isolated CABG Inpatient Mortality Rates for California and Other States (1996-2007) Note: rates may be defined slightly differently from state to state
What’s New • 2005-2006 Hospital and Surgeon Report release this week • Reporting on new outcomes and patient groups • Hospital post-operative stroke rates (in 2007 report) • Non-isolated CABG mortality (future release) • Online data reporting for hospitals • 2003-2005 CCORP researcher file available to qualified researchers • Stand-alone patient-level CCORP data file • Merged CCORP-Patient Discharge Data file
Questions • Contact information: Holly Hoegh, PhD Healthcare Outcomes Center Manager, Clinical Data Programs (916) 323-3868 hhoegh@oshpd.ca.gov www.oshpd.ca.gov OR Joseph Parker, PhD jparker@oshpd.ca.gov