Download
1 / 28
280 likes | 312 Views
APHLIS offers estimates of grain postharvest losses in Africa, aiding in hunger alleviation and economic growth through reliable data. Through a network of experts and transparent loss data, APHLIS seeks to improve food security planning and reduce poverty. Learn how to access PHL estimates and create your own for effective intervention strategies.

E N D
Postharvest Losses Information System APHLlS APHLIS for improved Food Security Planning JRC EUROPEAN COMMISSSION
APHLIS – the slideshow • What is APHLIS and what problems does it • address • How you can get PHL estimates from the • system • How you can generate your own PHL • estimates • The way forward
APHLIS -a unique service • APHLIS generates estimates of postharvest losses (PHLs) of cereals in East and Southern Africa and is • Based on a network of local experts who submit • data and verify loss estimates • Built on a complete survey of the literature on PHLs • APHLIS provides …… • Loss estimates by cereal, by country and by province • that are updated annually • A display of the data used to derive losses so the • system is fully transparent, and • The opportunity to add better loss data • so that loss estimation can improve over time
What are Postharvest Losses (PHLs)? PHLs (of cereals) are the cumulative weight losses from production from each link in the postharvest chain (including all grain not fit for human consumption but not PHLs from processing e.g. milling). Maize % weight losses 2007 from provinces of Zimbabwe and Ethiopia Postharvest chain
The Problem Soaring food prices and the economic recession are hampering efforts to reduce poverty. • PHLs have negative impacts on hunger, poverty alleviation, income generation and economic growth. Yet the magnitude and location of such losses are poorly understood because PHL figures are • mostly guesstimates • relatively difficult to trace for both logic • and info source, and • the sources themselves may not be very • reliable APHLlS
The advantages of better PHL estimates • By improving PHL estimates it will be possible in the short • term to - • Improve food security arrangements by calculating food • supply estimates more reliably from production figures • ….and long-term to target loss reduction interventions at – • the most affected areas (geographically) • the most affected links in the postharvest chain or those • that would be most cost effective to address, and APHLlS
A system for getting better PhL estimates • The main elements of APHLIS are – • Local expert network providing data and verifying PHLs • Database with access to local experts, by country, • PHL Calculator (model) that estimates losses • Web site for display of loss data by cereal for each • country and each province, in tables and in maps • Downloadable calculator for PHL estimation at any • geographical scale
APHLIS – the System in a nutshell PHL database Data tables Network of local experts PHL calculator Download PHL tables PHLs by crop country and province Agric. data Calculator spreadsheet GIS maps of PHLs etc
APHLIS network of experts – its most important resources Network of local experts to supply data and verify PHL estimates
How the PHL calculator works The PHL calculator determines a cumulative weight loss from production using loss figures for each link in the postharvest chain. A set of losses figures for the links of the postharvest chain is called a PHL profile Example of a PHL profile for maize grain Figures taken from the literature or contributed by network experts
PHL Calculator contd • PHL profiles are specific for • Climate type (A – tropical, B - arid/desert, C – warm temperate) • Crop type (different cereals) • Scale of farming (subsistence/commercial) Five examples of PHL profiles
PHL Calculator contd The PHL profile values are modified according to – Wet/damp weather at harvest Length of storage period (0-3, 4-6, >6 months) Larger grain borer infestation (for maize only) … and the PHL calculation takes into account – The number of harvests annually (1, 2 or 3) Amount of crop marketed or retained in farm storage NB PHL values are affected much more by the application of modifiers than by the initial selection of the PHL profile.
How to get a PHL estimate Postharvest Losses Information System Home • Two ways to get PHL estimates • Consult the tables and/or maps on the website for losses by region, country or province Losses estimates Losses maps (interactive) Literature Downloads PHL Network About us Contacts Links Production Yield Larger grain borer Average farm size
Loss tables Regional losses for all cereals and by cereal type Estimated Postharvest Losses (%) 2003 - 2009 Click APHLlS
Loss tables by cereal type and country Estimated Postharvest Losses (%) 2003 - 2009 Click
Loss tables by cereal type and province Estimated Postharvest Losses (%) 2003 - 2009 Click on one of these figures to get details of the loss calculation
Calculation matrix documenting the PH loss calculation quality of data sources and references to sources Country: Malawi Province: Area under National Administration Climate: Humid subtropical (Cwa) Year: 2007 Crop: Maize Details of the loss calculation. 1. Production data by farm type and losses over seasons Annual production and losses % tonne Production Grain remaining Lost grain Seasonal production and losses Remaining (%) Losses (%) Season Farm type Production (t) Remaining (t) Losses (t) Production (%)
PHL (%) calculation PHL (%) Calculation: Season: 1 Farm Type: small 20 Marketed at harvest (%) Marketed at harvest % - divides the harvest between what is stored on farm and what is sent to market. Details of the loss calculation 2. Factors modifying the PHL profile Rain at harvest – increases loss at harvest time. no data Rain at harvest no data Storage duration (months) Storage duration - loss increases with longer storage periods. Larger Grain Borer – LGB attack doubles farm storage losses. yes Larger grain borer
Details of the loss calculation 3. The PHL profile and loss increments PH profile (adjusted) Remaining grain Loss increment Stages Harvesting/field drying 6.4 69.5 4.8 4 66.8 2.8 Platform drying Threshing and shelling 1.2 66 0.8 - 66 0 Winnowing Transport to farm 2.3 64.4 1.5 Farm storage 9 58.6 5.8 Transport to market 1 58.6 0 Market storage 4 58.6 0 58.6 15.7 Total
Details of the loss calculation 4. Quality of the data in the PH profile and references to data sources Origin of figure Datum not a measured estimate Datum not specific to maize References and individual loss figures % for small farms Stages Loss figure Reference Cereal Climate Farm type Method 2.0 9.9 5.8 9.5 5.0 Harvesting/field drying 6.4 Data overall specific to maize The reference to Boxall 1998 Data overall not measured
The PHLs are also displayed on maps PHL values in 2007 Maize Sorghum Wheat APHLlS
There are also maps of LGB by year Locations where Larger Grain Borer (Prostephanus truncatus) was considered to be a significant pest in 2007 APHLlS
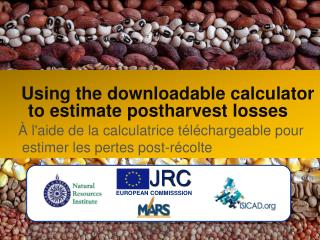
Getting your own PHL estimate- using the downloadable calculator The downloadable calculator lets you enter your own figures. It can • Work at whatever geographical scale is relevant • See all the details of the calculation • Assess the reliability and see the origin of data • Record multiple estimates and obtain weighted average PHLs
The downloadable calculator – front page Change language Open calculator You can change the default figures (in blue)
…………..changing the defaults You can change any of the default figures (in blue)
……… observing the calculation PHL profiles for large-scale & small -scale maize farming in Cwa climate Cumulative annual loss for one season
Conclusions • APHLIS generates PHL estimates for cereal grains that are - • Transparent in the way they are calculated • Contributed (in part) and verified by local experts • Updated annually with the latest production figures • Based on the primary national unit (i.e. province) • Upgradeable as more (reliable) loss data become • available
For the future • For the future APHLIS…….. • Would benefit from an effort to generate more PHL • data. • Should be made sustainable by efforts of the • international community. • Could be expanded in geographical range (W. Africa, • Asia, S. America) and technical content (e.g. pulses) • May be used in new ways, for example as unseasonal rain • becomes more common the impact of this on PHLs can be • predicted