Government Intervention
530 likes | 1.02k Views
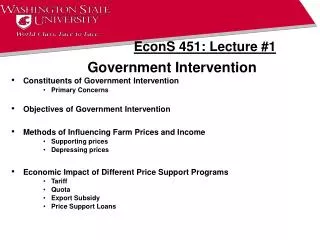
Constituents of Government Intervention Primary Concerns Objectives of Government Intervention Methods of Influencing Farm Prices and Income Supporting prices Depressing prices Economic Impact of Different Price Support Programs Tariff Quota Export Subsidy Price Support Loans.

Government Intervention
E N D
Presentation Transcript
Constituents of Government Intervention • Primary Concerns • Objectives of Government Intervention • Methods of Influencing Farm Prices and Income • Supporting prices • Depressing prices • Economic Impact of Different Price Support Programs • Tariff • Quota • Export Subsidy • Price Support Loans Government Intervention EconS 451: Lecture #1
Price Support Loans or Purchases Consumer expenditure and government costs from government purchases to maintain price above equilibrium. D S Price per unit P 2 P 1 Consumer Expenditures Government Purchases Q 1 Q 2 Quantity
Farm Program Goals Provide an economic safety net through farm income support to eligible producers, cooperatives and associations to help improve the economic stability and viability of the agricultural sector, and to ensure the production of an adequate and reasonably priced supply of food and fiber.
Characteristics of Ag Sector • Agriculture is different from other economic sectors.On the demand side: • With low food prices— • People don’t eat more meals a day • They may change mix of foods • Aggregate intake remains relatively stable
Characteristics of Ag Sector • Agriculture is different from other economic sectors.On the supply side: • With low crop prices— • Farmers continue to plant all their acres • Farmers don’t and “can’t afford to” reduce their application of fertilizer and other major yield-determining inputs • Who farms land may change • Essential resource—land—remains in production in short- to medium-run
Why Chronic Problems In Ag? • Technology typically expands output faster than population and exports expand demand • Much of this technology has been paid for by US taxpayers • The growth in supply now is being additionally fueled by • increased acreages in Brazil, etc. • technological advance worldwide
Why Chronic Problems In Ag? • Lower prices should automatically correct itself • Consumers buy more • Producers produce less • Prices recover—problem solved! • But in agriculture lower prices do not solve the problem • Little self-correction on the demand side • People do consume significantly more food • Little self-correction on the supply side • Farmers do not produce significantly less output
What Was That Again? • Supply and demand characteristics of aggregate agriculture cause chronic price and income problems • On average supply grows faster than demand (We will discuss ethanol later) • Agriculture cannot right itself when capsized by low prices • (Always year-to-year random variability)
Historically—there have beenTwo Major Components of Farm\Commodity Policy • Policy of Plenty: Ongoing public support to expand agricultural productive capacity through research, extension and other means • Policy to Manage Plenty: Mechanisms to manage productive capacity and to compensate farmers for consumers’ accrued benefits of productivity gains
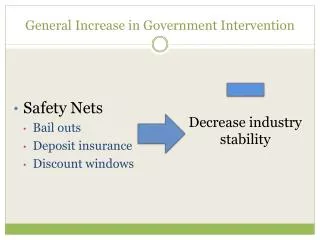
When Policy of Plentyis Too Much • Given agriculture’s inability to quickly adjust to overproduction and low prices, there are 3 policy strategies: • Supply side • Demand side • Money transfers
Traditional Farm Policy Elements • From 1973 (or earlier) to 1996, U.S. domestic farm policy generally included the following elements: • Base acreage • Acreage reduction / set-asides • Nonrecourse loans to support prices • Government storage of commodities • Domestic and foreign demand expansion • Food for Peace - Wikipedia, the free encyclopedia • How American Food Aid Keeps the Third World Hungry • Target price for major crop commodities • Deficiency payments for the difference between target price and market price
Government – “Farm Bill” • Every five years, Congress revisits and passes a massive piece of legislation known as the Farm Bill. 2007 will be one of those years. The 2007 could become the most scrutinized food-and-farm-policy debate in recent history. • Originally conceived as emergency support for millions of farmers and unemployed during the dark times of the Dust Bowl and Great Depression, the Farm Bill has snowballed into one of the most — if not the most — significant forces affecting food, farming, and land use in the United States. • Issues effecting the 2007 Farm Bill • Increasingly expensive and variable petroleum product prices and increasingly variable climatic conditions; • Looming water shortages and threatened fish populations; • Economically depressed rural communities; • Euphoria over corn and soybean expansion for biofuels; • Escalating medical and economic costs of child and adult obesity; • Continued Record payouts to corporate farms that aren’t even losing money; • Over 35 million Americans, half of them children, who don’t get enough to eat.
Farm Bill Overview What is the Farm Bill? • The Farm Bill is essentially a $90 billion tax bill for food, feed, fiber, and, more recently, fuel. Each bill receives a formal name, such as the Food and Agriculture Act of 1977, or the Federal Agriculture Improvement and Reform Act of 1996 (a.k.a. “Freedom to Farm”), but more often, each act is simply referred to as “the Farm Bill.” • While many people equate its programs and subsidies with assistance for struggling family farmers, the Farm Bill actually has two primary thrusts. Food stamps, school lunch, and other nutrition programs account for 50 percent of current spending — an average of $44 billion per year between 2000 and 2006. • Income and price supports for a number of storable commodity crops combine for another 35 percent of spending. • In addition, the Farm Bill funds a range of other program “titles,” including conservation and environment, forestry, renewable energy, research, and rural development.
What is the Farm Service Agency? • FSA is a federal agency that operates within the US Department of Agriculture and organizes/manages farmer direct programs • FSA headquarters is located in Washington, D.C. • Most of the agency’s staff is located in offices throughout the US and American trust territories • FSA’s 15,000-plus employees are based in 2,400 local USDA Service Centers around the US and Puerto Rico • “Grass roots” approach to service allows staffers to work one-on-one with producers • Program technicians, loan officers, administrative professionals and many others are employed to carry out FSA services
Farm Service Agency Programs • Direct and Counter-cyclical Payment program • Marketing Assistance Loans • Loan Deficiency Payments • Conservation Reserve Program • Conservation Reserve Enhancement Program • Disaster assistance • Farm loans • Commodity operations • Domestic and foreign food assistance
FSA Programs by Commodity Grains, Oilseeds and Cotton • Direct and Counter-Cyclical Payment Program • Hard White Wheat Incentive Payment Program • Extra Long Staple Cotton Competitiveness Program • Peanut Quota Holder Compensation Program • Marketing Assistance Loan and Loan Deficiency Payment Programs • Payments in Lieu of Loan Deficiency Payments for Grazed Acreage Program • High Moisture Corn and Sorghum Recourse Loan Program • Seed Cotton Recourse Loan Program
FSA Programs by Commodity • Dairy • Dairy Price Support Program • Milk Income Loss Contract Program • Dairy Indemnity Payment Program • Sugar • Sugar Allotment Program • Sugar Loan Program • Tobacco • Tobacco Program (burley, flue-cured and other tobaccos) http://www.fotosearch.com/photos-images/tobacco-field.html http://agpolicy.org/tobacco/Buyout%20Payments%20by%20State.pdf
YouTube - American Leaf: Tobacco's Last Harvest Clip #2 YouTube - American Leaf: Tobacco's Last Harvest Clip #1 YouTube - 2007 Agricultural Media Summit - Tobacco Farm Tobacco field Stock Photos and Images. 78 Tobacco field pictures and royalty free photography available to search from over 100 stock photo brands. http://agpolicy.org/tobacco/Buyout%20Payments%20by%20State.pdf
Direct and Counter-Cyclical Payment Program • The Farm Security and Rural Investment Act of 2002 replaced production flexibility contract payments (created under the 1996 act) with direct payments and added new counter-cyclical payments for 2002-07 crops • Both payments are based on historical acreage bases and payment yields, not current production • Payment rates are set in the 2002 Act • For each commodity, the direct payment equals the direct payment rate times 85 percent of the farm’s base acreage times the farm’s direct payment yield
Direct and Counter-Cyclical Payment Program • Counter-cyclical payments are made when a commodity’s effective price is below the target price • The effective price is the direct payment rate plus the higher of: (1) the national average market price received by producers during the marketing year or (2) the national loan rate for the commodity • Target prices are set in the 2002 act • The DCP program is available on-line • Submit contracts, assign crop shares and choose payment options, among other functions
Marketing Assistance Loans and Loan Deficiency Payments • Non-recourse marketing assistance loans help an eligible producer pay bills when they come due without having to sell the harvested crop at a time of year when prices tend to be lowest • When market conditions may be more favorable, a producer may sell the crop and repay the loan with the proceeds of the sale • Non-recourse marketing assistance loans give producers the option of delivering to CCC the quantity of a commodity pledged as collateral for a loan as full payment for that loan at loan maturity
Marketing Assistance Loans and Loan Deficiency Payments • In lieu of securing a non-recourse marketing assistance loan from CCC, a producer may be eligible for an LDP • This payment equals the amount by which the applicable loan rate where the commodity is stored exceeds the alternative loan repayment rate for the respective commodity • The LDP equals the LDP rate times the quantity of the commodity for which the LDP is requested • Market loan repayment and LDP provisions are intended to prevent delivery of loan collateral to CCC • The LDP program is available online • Submit an application and set up payment options, among other functions
Critical Changes in U.S. Policy • Since 1985 there has been: • An export “mindset” • A movement away from “managing plenty” to supporting income with government payments • This view culminated in the 1996 Farm Program “FAIR Act”: • Elimination of supply control instrument: set aside program • Replaced “price floors” with government payments • Farm Policy Presentation
Exports, Exports, Exports • For the last quarter century, exports have been heralded—and continue to be by some—as crop agriculture’s salvation • Exports is the production safety valve that can rebalance agricultural markets • Exports will grow at accelerating rates • The 2002 Farm Bill: Title III Trade
COOL (Country of Origin Labeling) Basic Details of Mandatory COOL Processed food is exempt as well as food service
Blended products may be difficult Ground Beef for Example:
Economic cost analysis COOL increases cost to MC2
Justifying MC increase Animal Production System – Segregation costs
What About Exports US Domestic Demand US Population US Exports *Adjusted for grain exported in meat Index of US Population, US Demand for 8 Crops and US Exports* of 8 Crops 1979=1.0
What About Exports? US Exports Thousand Metric Tons Developing Competitors’ Exports Developing competitors: Argentina, Brazil, China, India, Pakistan, Thailand, Vietnam 15 Crops: Wheat, Corn, Rice, Sorghum, Oats, Rye, Barley, Millet, Soybeans, Peanuts, Cottonseed, Rapeseed, Sunflower, Copra, and Palm Kernel
Exports and Govn Farm Policy • U.S. agricultural policymakers have long relied on the world marketplace to serve a diverse agenda–including management of the domestic farm economy, promotion of geopolitical interests, and most prominently, bolstering exports. The U.S. has aggressively pursued agroexport growth since the 1970s, when the nation experienced its first trade deficit of the century and the international community suffered a widespread food crisis. • Since the U.S. is the world's largest exporter of cereal grains, its domestic and foreign agricultural policy has a significant impact on the world market. • U.S. agricultural policy is aggressively targeted at building new market share and promoting international reliance on U.S. food exports. • Import dependency undermines international goals (formulated at the 1974 UN World Food Conference and embodied in the International Declaration of Human Rights) to encourage food self-reliance and security from hunger.
Trade effects • Consumer preference in targeted nations has shifted to U.S. cereals, mainly wheat and corn, as imports of these surplus U.S. commodities have flooded local markets. Indonesian consumers, for example, who have long enjoyed access to abundant supplies of locally produced rice, now prefer wheat noodles, partially as a result of cheap U.S. wheat subsidized through GSM credit programs. Once nations become dependent on foreign suppliers, following the loss of domestic production and shifts in consumer preference, they become increasingly vulnerable to international price and supply volatilities. • Worldwide grain shortages in 1996—led by declines in U.S. production—caused prices to double in U.S. and world markets. As a result of ballooning cereal prices, the FAO estimated that low-income-food-deficit countries (LIFDCs) experienced a 75 percent surge in their food import bills between 1995-96. As the supplier of more than one-third of world wheat exports and of other food grains, the U.S. now transfers its production fluctuations directly to the world market following recent changes in U.S. stockholding policy
Trade effects continued • Industrial country food importers, like Taiwan, can afford to ride out extreme fluctuations in grain import prices. These cycles are financially devastating, however, to LIC food importers, which account for 80 percent of world wheat imports and 60 percent of coarse grain (corn, barley, millet, oats, rye) imports. • Despite U.S. pledges to provide food during emergency periods of civil strife and crop disasters, the U.S. government’s four- million-ton Food Security Commodity Reserve will have little stabilizing effect in a world market that annually consumes 910 million tons of food grains. Counter-cyclical food aid programs are also unlikely to cushion the effect of future price surges. Once the main outlet for Commodity Credit Corporation (CCC) stocks, food aid and credit programs will become more expensive to operate as the U.S. government will need to purchase grains directly from the commercial market.
Implications from WTO • WTO negotiations drastically limit the ability to set domestic farm policy in this and other countries • Although new GATT commitments will impose little restraint on subsidy spending in the near future, new changes in U.S. federal stockholding policies could potentially curtail some in-kind subsidies—such as food aid. The U.S. government, which managed 26 million tons of grain annually on average from 1978-90, completed long-term plans in 1996 to eliminate virtually all its stockholdings by terminating its supply-management and Farmer-Owned-Reserve programs. • Food security and other social objectives often trump economic considerations in the case of food and agriculture
Problems with Current U.S. Policy Key Problems • U.S. export-expansion policies have undermined foreign production capacity, altered consumer preference, and consequently created dependence on imports of wheat and other grains. • Domestic U.S. farm policies aggravate supply and price volatility for wheat and other cereal crops. • Developing nations are pressured during trade negotiations to exchange domestic food security policies for access to the world trade market and debt-servicing arrangements. • The use of subsidies and trade negotiations to promote U.S. agroexport growth has resulted in a dangerous dependency on imported food grains among many countries while undermining the food security plans of several U.S. trade partners. • The PL-480 program, EEP, and other export-promotion programs have effectively undermined the capability of targeted nations to produce and store native staples. Subsidized prices of conventional wheat and corn imports regularly undercut the prices of domestically and regionally produced varieties of staple grains.
Domestic Policy Impacts? • Crop producers get subsidy support while real subsidy beneficiaries (integrated livestock producers and other users, sellers of inputs and marketers of output) remain above the fray • Tufts University estimated that the poultry and hog industries alone saved $20 billion between 1997 and 2005 because corn and soybean prices were below the cost of production • Tyson saved $2.6 billion • Smithfield saved $2.5 billion
Different Government Program Constituents Small Family Farmers
Different Government Program Constituents Larger Scale Farmers
Different Government Program Constituents Agribusiness
Different Government Program Constituents Taxpayers Consumers
Different Government Program Constituents Environmentalists
Different Government Program Constituents Rural Communities
Different Government Program Constituents Social Welfare Advocates
History of Government Support • Price parity…….1930’s….1940’s……..1960’s. • Price support loans……1960’s…..current • (mostly storable commodities). • Movement toward more market oriented supports. • Opening of trade corridors……..globalization.
Objectives of Government Intervention • Support and raise farm incomes. • Protect or preserve small farms and to slow the rate of exodus from rural areas. • Achieve self-sufficiency in food and fiber production or to decrease dependence on imports. • Reduce price and income instability. • Hold down consumer costs and/or increase consumption of food and fiber products.
Methods of Influencing Farm Prices Supporting or Raising Farm Prices • Government acquisition or purchase • Price-support loans • Guaranteed or target prices from government payments • Direct and indirect export subsidies • Supply reduction schemes • Domestic food subsidies and/or distribution programs • Tariffs, variable levies, import quotas or other restrictions on imports.
Methods of Influencing Farm Prices Depress or hold down commodity prices • Price ceilings • Relax import controls • Release stocks from government controlled stocks • Embargoes on exports
Price Support Loans or Purchases Consumer expenditure and government costs from government purchases to maintain price above equilibrium. D S Price per unit P 2 P 1 Consumer Expenditures Government Purchases Q 1 Q 2 Quantity
Deficiency Payments Consumer expenditure and government payments from supporting price above equilibrium by making deficiency payments. D S Government Payments Price per unit P 3 P 2 P 1 Consumer Expenditures Q 1 Q 2 Quantity