Download

1 / 33
350 likes | 515 Views
Learn about consumer and producer surplus, price controls, taxes, subsidies, tariffs, and more. Explore how government intervention impacts market efficiency and social responsibility.

E N D
Government Intervention & Market Failure AP Micro Module 4
Objectives • By the end of this module, SWBAT • Define and graph consumer and producer surplus • Define and graph price floors and price ceilings • Explain how the elasticity of demand and supply curves affects surplus and tax burden • Explain and graph taxes and tariffs and define deadweight loss • Contrast subsidies and their effects to taxes and tariffs
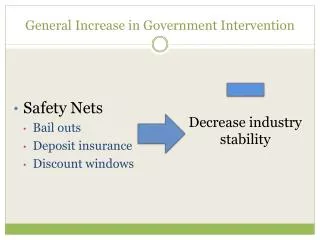
SLOs • Social Responsibility • At times, Smith’s invisible hand can create conditions that are unduly harsh for some consumers and producers • These groups lobby the government to step in and provide a “safety net” • The question as America moves forward is should the government continue to play this role and if not, what can ordinary actors in the market do to protect themselves?
Efficiency • Markets that operate at equilibrium price are at max efficiency • The large triangle formed by the P axis, demand curve and supply curve represents TOTAL SURPLUS • TOTAL SURPLUS is the total number of transactions that takes place between consumers and producers
Efficiency • The smaller triangle inside total surplus above the equilibrium price is the CONSUMER SURPLUS • The smaller triangle inside total surplus below the equilibrium price is the PRODUCER SURPLUS
Elasticity and Surplus • Changes to the elasticity of demand and supply curves allocate different shares of total surplus to producers and consumers
When Equilibrium Fails… • Sometimes, market forces move equilibrium price (aka market price) to an undesirable amount • Governments have two options • Price controls • Taxes/Subsidies
Price Floors • Must be placed ABOVE equilibrium to be “binding” • Prices want to fall toward equilibrium but they cannot • Creates extra surplus goods because Q supplied > Q demanded at the price floor
Price Ceiling • Prices want to rise to equilibrium but cannot • Create shortages because Q demanded > Q supplied at price ceiling • Must be placed BELOW equilibrium to be “binding”
Taxes • From a liberal economic point of view, taxes are always inefficient – artificially inflate prices and negate business transactions • Society needs them, however, since tax revenue is used to: • Provide services which are common goods that are hard to privatize (i.e. street lights, sewers) • Undo the negative externalities caused by economic activity (i.e. EPA to fight pollution)
Taxes • On a graph, any tax price must be ABOVE equilibrium price to be binding • Draw a line at the tax price from the P axis to the right until you reach the demand curve • Then draw a perpendicular line down to the Q axis • The segment of this vertical line between the demand and supply curves is called the TAX INCIDENCE
Taxes • On a graph, the TAX REVENUE is area of the rectangle that is formed by the tax incidence (height) times the quantity demanded or supplied at the tax price (base) • The purple triangle to the right of the tax incidence is the DEADWEIGHT LOSS, or transactions that no longer take place because of the tax
Taxes and Elasticity • Just like in the surplus example before, different elasticity of each curve will cause the tax burden to shift from the producer to the consumer or vice versa
Determinants of Elasticity of Supply • Supply curves might change elasticity due to • availability of materials - The limited availability of raw materials could limit the amount of a product that can be produced. • length and complexity of product - If the product is complex to manufacture, it becomes more inelastic • time to respond - If the producer has more time to respond to price changes, the product is more elastic • excess capacity - A producer with unused capacity will quickly respond to price changes
International Trade • Consider any supply and demand curve situation and locate the equilibrium price • This price is also the domestic price • Also represented are domestic consumer surplus and domestic producer surplus • When we introduce an international price or “world price” to the situation, any particular nation becomes an importer or exporter of that particular good based on the difference between the domestic price and the world price
Exports • A nation is an exporter IF the domestic price of a good is LESS than the world price • The triangle above equilibrium and between demand and supply curves represents the “foreign consumer surplus” which is equal to the added producer surplus of all of the exporters in the nation
Imports • A nation is an importer IF the domestic price is MORE than the world price • The triangle below equilibrium and between the supply and demand curves is the “imported consumer surplus” which is equal to the added producer surplus of the exporter nation
Tariffs • Although less popular these days than in the late 19th and early 20th centuries, tariffs (or taxes on imports) can effectively increase domestic producer surplus in importer nations • They will, however, cause a deadweight loss because they are taxes but… • They will, however, generate revenue because they are taxes • In order to be binding, tariffs must create a higher world price in order to make the domestic price (equilibrium price) more competitive and boost domestic producer surplus
Tariffs • Shown here, the tariff price is in the middle, between equilibrium and the world price • The blue box is the tax revenue it generates • The orange triangle of producer surplus has now added a substantial trapezoid to its area
Tariffs • The green triangle, consumer surplus, has shrunk a bit but is still substantial • The two pink triangles, however, are deadweight losses of the tariffs, representing the import transactions that will no longer happen due to the influence of the tariff
Important Reminder • Tax revenue boxes will ALWAYS be rectangular • Deadweight losses will ALWAYS be triangular
Subsidies • Artificial boosts to mostly supply but also sometimes demand in order to protect and support producers in certain industries • Work in an “opposite” way as taxes • Will provide more surplus for consumers and producers instead of hand revenue to government • Will create more transactions to offset the “deadweight loss effect”
Subsidies • Literally, subsidies are the best of both worlds so to speak • Create lower prices for consumers • Generate quantity supplied levels as if market price was higher for producers
Subsidies • Region “a” in the figure to the right represents all of the new transactions that the subsidies create • In most cases, subsidies are used when prices of a certain key good in the marketplace drop too low • Much like a price floor in this way, keep prices artificially high but with the benefit of not making consumer pay higher prices directly at the market
Subsidies • In this example, what would the subsidy’s revenue be?
Summary • Remember that although classical liberal economists would love to convince you that Smith’s invisible hand is enough to prevent market failure and promote efficiency, the government must still act from time to time to ensure prosperity
Summary • Prices that are too low can be combated with price floors and supply subsidies (think agriculture) • Prices that are too high can be regulated with price ceilings and demand subsidies (think rent control apartments and electric cars) • Unbalanced international trade scenarios can be normalized with tariffs, although most of the world is moving toward free trade and less trade boundaries
Summary • Taxes are inherently inefficient and should be crafted to minimize deadweight loss in the economy • Taxes that are too low not worth having generate too little tax revenue • Taxes that are too high too disruptive generate too little tax revenue AND create massive deadweight loss
Summary • The best taxes are like Goldilocks – just right • A visual representation of this concept is the Laffer Curve • Compromise between tax revenue and the surpluses of the consumer and producer to promote economic growth
Summary • Government intervention in the economy is inevitable • The tools used by a federal government to conduct this intervention are collectively called “fiscal policy” tool • Taxes • Spending programs • Economic tools used by financiers to regulate an economy are called “monetary policy” tools and they are distinct from this section and will be discussed separately