Infographics
Download the PDF: https://www.demandmetric.com/content/increase-your-presence-infographics
The brain processes visual information more quickly than text and it retains more of that information.
90% of information transmitted to the brain is visual and visuals are processed 60,000 times
faster in the brain than text. Indeed, a picture can be worth a thousand words; infographics exploit
the brain's power to absorb images, allowing us to capitalize on the advantages visuals can have
over text.
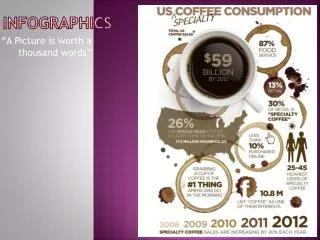
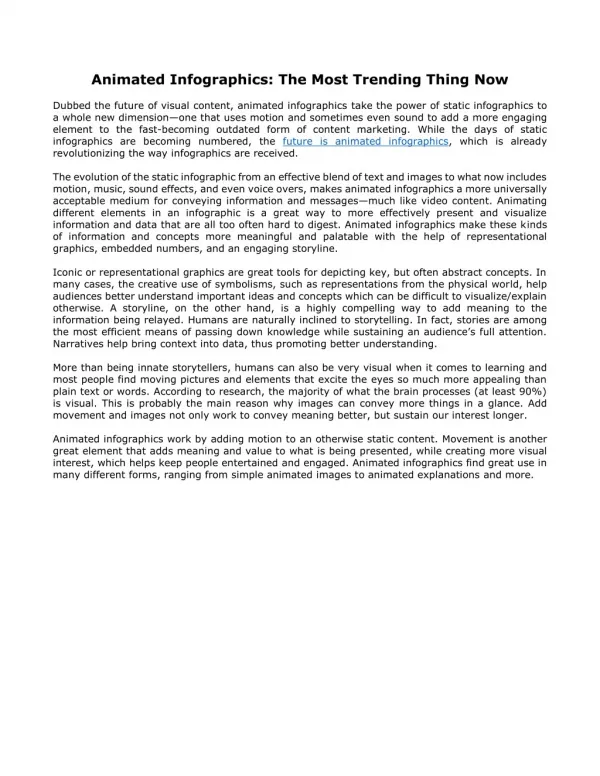
An infographic is a visual representation of information, data and knowledge that is intended to
quickly and clearly communicate complex data. Devices include maps, charts, diagrams, lists and
graphs. Infographics tell us a story using accurate information and data in a visual form.
Infographics help access information as quickly as possible by providing viewers with a snapshot
of complex data that is easy to read and enables sharing of a lot of information in a short amount
of time. Because they are easy to share, infographics have the potential for generating lots of web
traffic and therefore are valuable marketing tools.
This How-To Guide will outline the key elements of an infographic, explain how infographics
benefit marketers, and provide an action plan .
172 views • 14 slides