Infographics
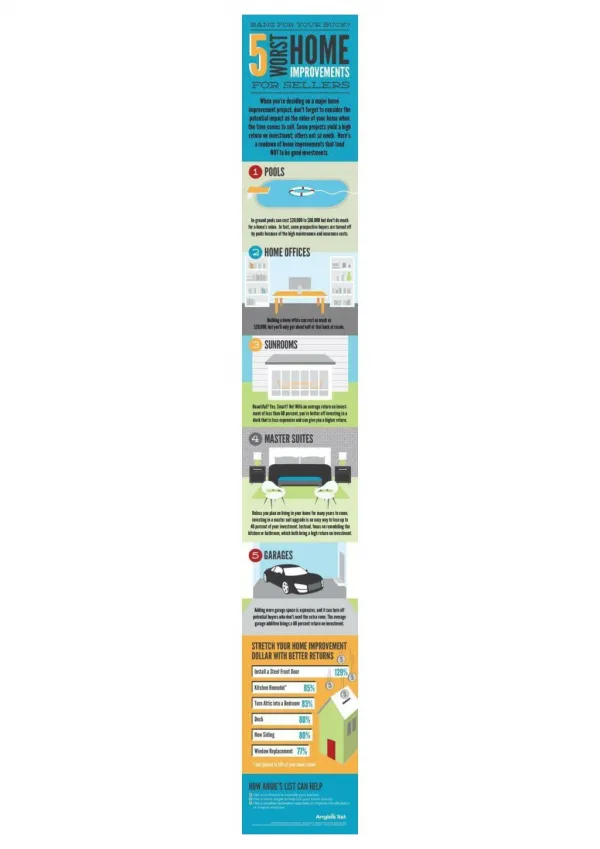
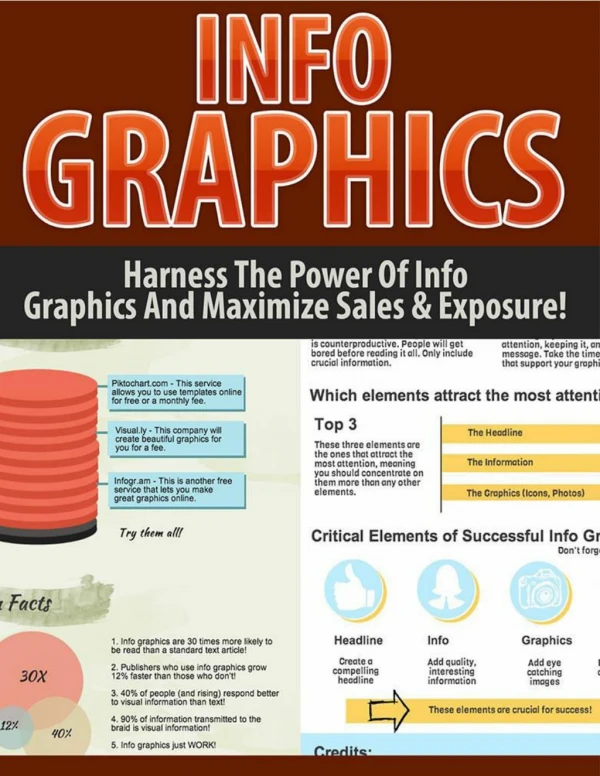
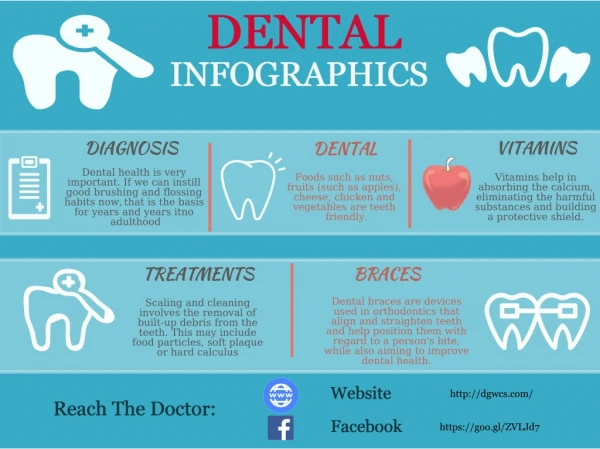
Infographics. Overview on What is important Traditional graphs Charts for specific usages Common misleading factors Read also the two books. 1. What is represented? Is something misleading? Is something useless? Is something missing? Can other information be added ?.

Infographics
E N D
Presentation Transcript
Infographics Overview on What is important Traditional graphs Charts for specific usages Common misleading factors Read also the two books 1
What is represented? Is something misleading? Is something useless? Is something missing? Can other information be added? Fundamental scopes 2
Scale or numeric variables time, age, weight, distance in Kilometers, length, number of children, GDP Nominal or categorical variables country of residence, sex, degreecourse Ordinal variables Likert scale Using them as nominal or scale variables Scales Logarithmicscale Variables
Onenominalvariable • Column plot
Onenominalvariable • Pie chart • Radar graph
Onenominalvariable • Bar plot • Line plot
Onenominalvariable • Area plot • 3D variants
12 One scale variable 8 4 • Building an histogram • groupingintobins 0 $1,000 $2,000 $3,000 $4,000 $5,000
8 30 One scale variable 6 20 4 10 2 • Choosing the binscarefully 0 $1,000 $2,000 $3,000 $4,000 $5,000 $1,000 $2,000 $3,000 $4,000 $5,000
One scale variable • Boxplot • Median in black line • Central 50% is in the rectangle • Central 90% isbetweenwhiskers • Extremes are symbols
One scale variable case by case • Use any appropriate nominalvariablegraph
Nominalversus nominal • Side by side • Stacked
Nominalversus nominal • Appropriate 3D variants
Nominalversus nominal • a rare example of a usefulstacked area chart
Nominalversus scale • Boxplot side by side • Histogramoneabove the other
Scale versus scale • Scatterplot
Scale versus scale • Mathematical graph • Regression line
Three scale variables • Surface plot
Three scale variables • Bubble chart • www.gapminder.org
Bubble chart with Google Developers • https://developers.google.com/chart/interactive/docs/gallery/bubblechart • create HTML file which displays graph in browser • insert data manually with Notepad • modify options manually with Notepad • see book for detailed list of instructions • is asked at exam in the open-books practical part • … also graph creating with Excel is asked (see mandatory exercises)
Statsilk software • www.statsilk.com
Time series • Financial chart
Time series • Gantt chart
Misleadingfactors • Distractibleelements
Misleadingfactors • Elements in the wrongplace
Misleadingfactors • Wrongproportions
Misleadingfactors • Right proportions
Misleadingfactors • Different units of measure
Misleading factors • Not starting from zero
Misleading factors • Two and three dimensional growth
Misleading factors • Two and three dimensional growth