Download
1 / 12
120 likes | 167 Views
A simple, rapid, precise, and accurate stability-indicating, reversed phase (RP) HPLC assay method was<br>developed and validated for simultaneous estimation of Lamivudine (3TC) and Stavudine (d4T) in bulk<br>drugs and commercial tablets. The method has shown adequate separation of 3TC and d4T from their<br>degradation products. Separation was achieved on a Kromasil C8 (250mm×4.6mm i.d; 5 µm) column at<br>a detection wavelength of 265nm, using a mobile phase consisting of acetonitrile–0.02M ammonium<br>acetate buffer (pH 4.5) in a gradient elution mode at a flow rate of 1 ml/min. The retention times for<br>lamivudine and stavudine were found to be 13.66 and 16.51 min respectively Lamivudine (3TC),<br>stavudine (d4T) and their combination drug product were subjected to acid, base and neutral hydrolysis,<br>oxidation, thermal and photolytic stress conditions and the stressed samples were analyzed by the<br>proposed method. Validation of the method was carried out as per ICH guidelines. Quantitation was<br>achieved with UV detection at 265 nm based on peak area with linear calibration curves at concentration<br>ranges 2.5-50µg/ml for 3TC and 0.5-10µg/ml for d4T (R2<br> > 0.9999 for both drugs). The limits of detection<br>were 0.82 µg/ml and 0.33 µg/ml for lamivudine and stavudine, respectively. The method was found to be<br>specific and stability indicating as no interfering peaks of degradants and excipients were observed. The<br>proposed method is hence suitable for application in quality-control laboratories for quantitative analysis<br>of both the drugs individually and in combination dosage forms, since it is simple and rapid with good<br>accuracy and precision

E N D
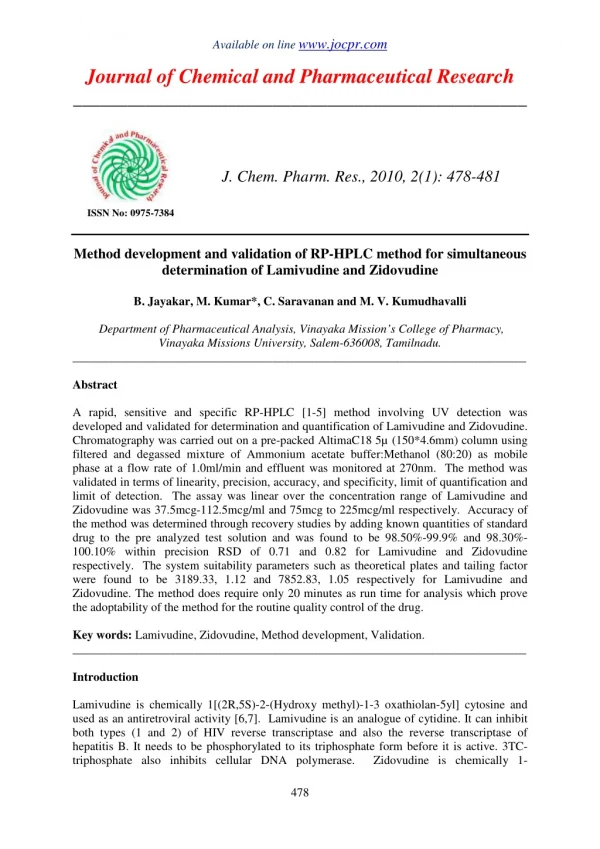
Available online www.jocpr.com Journal of Chemical and Pharmaceutical Research __________________________________________________ J. Chem. Pharm. Res., 2011, 3(6):200-211 ISSN No: 0975-7384 CODEN(USA): JCPRC5 Development and validation of a stability indicating RP-HPLC method for simultaneous determination of Lamivudine and Stavudine in combined dosage forms Umesh M. Patel1 and R. Nageswara Rao2* 1National Institute of Pharmaceutical Education and Research (NIPER), Balanagar, Hyderabad, India 2Analytical Chemistry Division, Indian Institute of Chemical Technology, Tarnaka, Hyderabad, India ______________________________________________________________________________ ABSTRACT A simple, rapid, precise, and accurate stability-indicating, reversed phase (RP) HPLC assay method was developed and validated for simultaneous estimation of Lamivudine (3TC) and Stavudine (d4T) in bulk drugs and commercial tablets. The method has shown adequate separation of 3TC and d4T from their degradation products. Separation was achieved on a Kromasil C8 (250mm×4.6mm i.d; 5 µm) column at a detection wavelength of 265nm, using a mobile phase consisting of acetonitrile–0.02M ammonium acetate buffer (pH 4.5) in a gradient elution mode at a flow rate of 1 ml/min. The retention times for lamivudine and stavudine were found to be 13.66 and 16.51 min respectively Lamivudine (3TC), stavudine (d4T) and their combination drug product were subjected to acid, base and neutral hydrolysis, oxidation, thermal and photolytic stress conditions and the stressed samples were analyzed by the proposed method. Validation of the method was carried out as per ICH guidelines. Quantitation was achieved with UV detection at 265 nm based on peak area with linear calibration curves at concentration ranges 2.5-50µg/ml for 3TC and 0.5-10µg/ml for d4T (R2 > 0.9999 for both drugs). The limits of detection were 0.82 µg/ml and 0.33 µg/ml for lamivudine and stavudine, respectively. The method was found to be specific and stability indicating as no interfering peaks of degradants and excipients were observed. The proposed method is hence suitable for application in quality-control laboratories for quantitative analysis of both the drugs individually and in combination dosage forms, since it is simple and rapid with good accuracy and precision Key Words: Stavudine, Lamivudine, RP-HPLC, Stability indicating assay, Forced degradation, Method Validation. ______________________________________________________________________________ INTRODUCTION Lamivudine is chemically [(2R, cis)-4-Amino-1-[2-(hydroxymethyl)-1, 3-oxathilan-5-yl]-(1H)- pyrimidin-2-one; 3TC] (Fig. 1). It is a nucleoside reverse transcriptase inhibitor (NRTI) with activity against HIV-1, a causative agent of acquired immune deficiency syndrome (AIDS) and 200
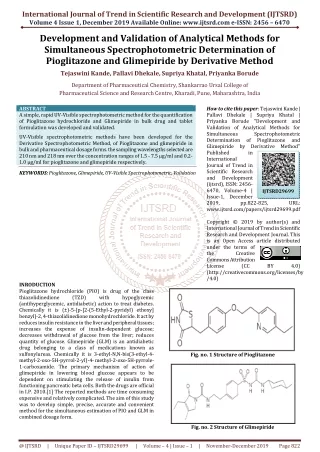
R. Nageswara Raoet al ______________________________________________________________________________ J. Chem. Pharm. Res., 2011, 3(6):200-211 Hepatitis B viruses [1-3]. Stavudine is chemically [1-[(2R, 5S)-5-(hydroxymethyl)-2,5- dihydrofuran-2-yl]-5-methylpyrimidine; d4T] (Fig. 1). It is a synthetic thymidine analogue with potent inhibitory activity against HIV-1 in vitro [4]. Since therapy with NRTIs for treatment against HIV-1 results in rapid development of HIC strains, co-administration of other antiretroviral therapies is necessary [5, 6].The US Department of Health and Human services’ current guideline for treatment of established HIV infection strongly recommends lamivudine in combination with stavudine and other NRTIs [7]. O NH2 H3C NH N N O O N O HO O OH S 3TC d4T Fig.1 Chemical structures of Lamivudine (3TC) and Stavudine (d4T) Forced degradation of lamivudine (3TC) was studied by some workers and the degradation products were analyzed by HPTLC. 3TC was reported to be unstable to acidic, basic, oxidative, and wet heat, and photolytic stress conditions [8]. Five degradation products of 3TC were reported in the literature under different stress conditions analyzed by LC, LC-MS/TOF, and MSn [9]. However some impurities of 3TC were described in the draft monograph of International Pharmacopoeia [10]. A variety of analytical methods were reported for determination of 3TC in different dosage forms as well as in biological samples, viz., blood, urine, plasma, serum, etc. The techniques employed for the analysis include HPLC [11-16] and LC-MS [17, 18]. Mandloi et al, reportedan in vitro dissolution study of Lamivudine in bulk drug and tablet formulations [19].Sudha et al, have developed a U.V. Spectrophotometric method for simultaneous estimation of lamivudine and abacavir sulphate [20].Stavudine (d4T) has been reported to be unstable in acidic, alkaline, neutral hydrolysis, oxidation [21, 22]. Only one degradation product i.e. thymine was reported in literature. However some impurities of d4T were also described in the draft monograph in International Pharmacopoeia [23].A number of reports exist on procedures for determination of d4T in bulk drugs, and biological fluids, such as plasma, serum and urine [24-29]. A thorough literature search revealed that only few methods i.e., HPLC and derivative spectrophotometry for simultaneous determination of 3TC and d4T in fixed dose combinations were reported [30-33]. However, these methods lack stability indicating nature. Also, none of the reported procedures enable analysis of both the drugs in pharmaceutical dosage forms in presence of their degradation products [34-36]. In the present investigation, an attempt was made to develop a simple, rapid, precise and accurate stability indicating RP-HPLC assay method for simultaneous estimation of 3TC and d4T in presence of their degradation products. This proposed method can be successfully employed for quality control during manufacture and for assessment of the stability of both drugs in bulk samples and combined dosage forms 201
R. Nageswara Raoet al ______________________________________________________________________________ J. Chem. Pharm. Res., 2011, 3(6):200-211 EXPERIMENTAL SECTION Chemicals and Reagents Lamivudine [99.8%w/w] and stavudine [99.9%w/w] were donated from Hetero Drugs Limited [Hyderabad, India]. Lamistar-30 tablets containing Lamivudine-150 mg, and Stavudine-30 mg were purchased from Hetero pharmacy (Hyderabad, India). Glass–distilled and de-ionised water [Nanopure, Barnsted, (USA)], HPLC- gradient grade acetonitrile [Qualigens Fine-Chemicals (Mumbai, India)] and ammonium acetate and glacial acetic acid of analytical- reagent grade [M/s SD Fine Chemicals (Mumbai, India) ] were used. Sodium hydroxide, hydrochloric acid and hydrogen peroxide were of analytical-reagent grade from Qualigens Fine Chemicals (Mumbai, India). Apparatus and Equipments Shimadzu HPLC system consisted of an on-line degasser (DGU-20A3), pressure pump (LC- 20AT), UV-visible dual-wavelength detector (SPD-20AV), system controller (SCL-10AV) and LC-SOLUTION software version 1.11SP1 (all modules from Shimadzu, Kyoto, Japan). Kromasil C8 column (250 mm x 4.6 mm i.d., particle size 5 µm) was used. Precision water baths equipped with MV controller (Julabo, Seelbach, Germany) were used for solution degradation studies. Accelerated stability studies were carried out in humidity (KBF720, Binder, Germany), and photostability (KBWF 240, WTC Binder, Germany) chambers both set at 40 °C ± 1 °C/75% RH ± 3% RH. The photostability chamber was equipped with an illumination bank on inside top consisting of a combination of two black light UV lamps (OSRAM L18 W/73) and four white fluorescent 17 lamps (OSRAM L18 W/20), all in accordance with ‘Option 2’ of ICH guideline Q1B [37]. Both fluorescent and UV lamps were put on simultaneously. pH/Ion analyser (MA 235, Mettler Toledo, and Schwerzenbach, Switzerland) was used to adjust and check the pH of buffers and other solutions. Other equipments used were ultra-sonicator (model 3210, Branson Ultrasonics Corporation, Connecticut, USA), Schwerzenbach, Switzerland) and auto pipettes (Eppendorf, Hamburg, Germany). Chromatographic conditions An effective Chromatographic separation of compounds was achieved on Kromasil C-8 (250mm×4.6mm i.d; 5µm Particle size) column with gradient elution using acetonitrile (A), and ammonium acetate buffer (B) (0.02 M, pH 4.5 adjusted by glacial acetic acid) as Mobile phase. The optimized gradient elution program is listed in Table I. The Mobile phase was pumped at rate of 1mL/min. Before use, it was filtered through a 0.45 µm Chrom Tech Nylon-66 filter and degassed in an ultrasonic bath. The column temperature was maintained at 25°C by use of the column oven. The injection volume 20 µl was used and eluents were monitored using the Dual wavelength detector set at 265 nm. Preparation of Stock and Standard Solutions Standard stock solutions (1mg/mL) of 3TC and d4T were prepared in deionized water as both of the drugs are freely soluble in water. Each stock solution was diluted with mobile phase (B) to obtain various concentrations of each compound: a range of 2.5-50 µg/mLfor 3TC and 0.5-10 µg/mL for d4T.These solutions were used to calculate the linear dynamic range and for the relative quantification of the tablets. The diluted solution was filtered through 0.22 µm Nylon membrane syringe filter and of which 20 µl was injected for HPLC analysis. All solutions were stored at 2-8oC, protected from light using aluminum foil and were brought to room temperature before use. analytical balance (Mettler Toledo, 202
R. Nageswara Raoet al ______________________________________________________________________________ J. Chem. Pharm. Res., 2011, 3(6):200-211 Sample Preparation for Tablet Assay Twenty tablets were weighed and finely powdered. An amount of tablet powder equivalent to 250 mg of 3TC, and 50 mg of d4T were accurately weighed, transferred into a 250 ml volumetric flask and to this, 100 ml of deionised water was added. The mixture was subjected to sonication for 30min for complete extraction of drugs, and the solution was made up to the mark with deionised water to obtain a nominal concentration of 3TC and d4T as 1 and 0.2 mg/mL, respectively. The solution was then diluted with mobile phase (B) to yield concentration of 25 µg/mL for 3TC and 5 µg/mL for d4T.The diluted solution was filtered through 0.22 µm Nylon membrane syringe filter and of which 20µl was injected for HPLC analysis Method Validation The analytical method was validated for various parameters as per ICH guideline [38]. Forced Degradation Study/specificity To determine whether the method was stability-indicating, combined tablet dosage forms and active pharmaceutical ingredient (API) powder of both the drugs were stressed under different conditions to promote degradation [30]. Regulatory guidance in ICH Q2A, Q2B, Q3B and FDA 21 CFR section 211 requires the development and validation of stability-indicating potency assays. Solutions used in forced degradation studies were prepared by dissolving API and drug product in small volumes of HPLC-grade water and then diluting with aqueous hydrogen peroxide, HPLC-grade water, aqueous hydrochloric acid, or aqueous sodium hydroxide to achieve final concentrations of 1.0 mg/mL for 3TC and 0.2 mg/mL for d4T. After degradation, the solutions were diluted with mobile phase (B). Solutions for use in oxidation studies were prepared in water and 30% H2O2 (20:80, v/v) and kept at room temperature. The resulting solution was analysed after 48 hrs. Solutions for acid degradation studies were prepared in water and 0.1 M hydrochloric acid (20:80, v/v) and the resulting solution was heated at 80ºC under reflux for 48 hrs. Solutions for alkaline degradation studies were prepared in water and 0.1 M sodium hydroxide (20:80, v/v) and the resulting solution was heated at 80ºC under reflux for 48 hrs. Solutions for neutral degradation studies were prepared in water and the resulting solution was heated at 80ºC under reflux for 72 hrs. To study the effect of thermal stress, combination drug product and API powder were exposed to dry heat (100°C) in a convection oven for 10 days. The samples were then removed from the oven, twenty tablets were crushed and thoroughly mixed, and amounts of powder equivalent to the weight of 250 mg of 3TC and 50 mg of d4T were diluted with mobile phase (B) to yield final concentration of 25 µg/mL for 3TC and 5 µg/mL for d4T and analysed in HPLC. To determine the effects of irradiation on both the drugs in solution and solid state, combination drug product, API powder, and solutions of both drugs were exposed to UV and fluorescent light [33]. Approximately 100 mg API powder was spread on a glass dish in a layer of 1 mm thick. A solutions of 3TC (1 mg/mL) and d4T (0.2 mg/mL) were prepared by dissolving API powder in deionised water. Tablets were prepared in the same way. The solutions and solid drugs for photostability testing were placed in a photostability chamber and exposed to1.2 x 106 lux hr of fluorescent light and 200 watt hr /m2 of UV radiation 320-400 nm for 10 days. After removal from the light cabinet, the samples were diluted with mobile phase (B) to yield final 203
R. Nageswara Raoet al ______________________________________________________________________________ J. Chem. Pharm. Res., 2011, 3(6):200-211 concentration of 25 µg/mL for 3TC and 5 µg/mL for d4T and analysed in HPLC. Dark control was run simultaneously. Linearity The linearity of the method was determined in concentration range of 2.5-50 µg/mlfor 3TC and 0.5-10 µg/mlfor d4T. Each solution was injected in triplicate. The peak area versus concentration data of both drugs was treated by least squares linear regression analysis. Linearity was checked over the same concentration range on three consecutive days. LOD and LOQ The limit of detection (LOD) and quantitation (LOQ) for both 3TC, and d4T were determined using standard deviation method according to ICH guideline Q2 (R1) [34]. LOD was defined as 3.3r/S and LOQ was 10r/S based on ‘standard deviation of the response and average slope’ of the calibration curve around target concentration [39]. Precision Intra-day precision (repeatability), as RSD (%) was investigated by injecting threereplicate samples of each of 3TC and d4T at three different levels (80% 100% 120% of target concentration). Intermediate precision (inter-day) was evaluated by monitoring on three consecutive days in the same laboratory. Accuracy, as Recovery Accuracy was evaluated in triplicate, at three different concentrations equivalent to 80, 100, and 120% of the target concentration of active ingredient, by adding a known amount of each of the standard to a sample of known concentration of both drugs and calculating the recovery, RSD (%) for each concentration. Robustness To evaluate the robustness of the method, the chromatographic conditions were deliberately altered and degree of reproducibility was evaluated. During robustness testing each condition was varied separately, all other conditions being held constant at the optimized values. Robustness of the proposed method was assessed with respect to small alterations in the buffer concentration (0.02 ± 0.005 M), the pH value (4.5 ± 0.1), flow rate (1.0 ± 0.1mL/min), and RP C8 columns (Phenomenex® and Kromasil®). Solution Stability Stability of solutions during analysis was demonstrated by analysis of stock solutions over a period of 2 weeks at 4oC. For short term stability the working solutions were analyzed after 48 hrs at room temperature storage. The results were compared with those obtained from freshly prepared standard solutions. RESULTS AND DISCUSSION HPLC method development and optimization Most of all reported HPLC methods till date use C-8 or C-18 columns. Most of these use complex mobile phase compositions. Hence, attempts were directed towards development of a simple and better method on commonly used C8 column with good resolution. Different logical modifications were tried to get good separation among the drugs and the degraded products. 204
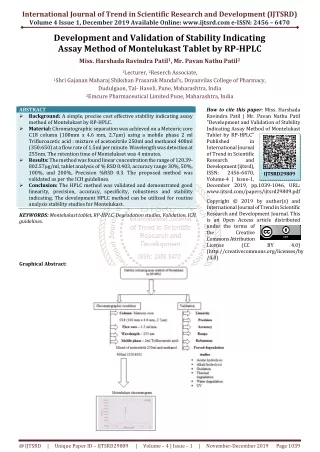
R. Nageswara Raoet al ______________________________________________________________________________ J. Chem. Pharm. Res., 2011, 3(6):200-211 These changes included change in buffer pH, mobile phase composition, and molarity of acetate buffer in isocratic as well as gradient elution modes on different C8 columns Table I RP-HPLC gradient elution program Time (Min) %Mobile phase A %Mobile phase B 0.01 99 10 90 15 99 20 (stop) 99 Table II Results from Forced degradation Studies 1 10 1 1 Stavudine (d4T) Degradation peaks Lamivudine (3TC) Stress conditions and duration %Degradation Degradation peaks %Degradation Solution State Forced Degradation Studies Neutral/Deionized water/80°C reflux/72 h Acidic/0.1 M HCl/80°C reflux/48 h Basic/0.1 M NaOH/80°C reflux/48 h Oxidizing/30% H2O2/RT/48 h Photolysis/UV light, Deionized water/40°C-75%RH/10 days Solid State Forced Degradation Studies Thermal/100°C/10 days Photolysis/UV light/40°C-75%RH/10 days TH TH TH TH TH 100.0 78.8 20.0 33.9 25.7 - 0.0 22.3 59.5 25.1 0 I,II,V I,II,V III,IV - - - 0.0 0.0 - - 0.0 0.0 Table III Results from Regression line analysis Parameters Linearity range (µg/ml) Regression line equation y = 50416x + 14445 y =5099.x + 14565 Correlation coefficient (r) 0.9999 No of data points LOD (µg/ml) LOQ (µg/ml),%RSD 2.5,0.66% 3TC 2.5-50 d4T 0.5-10 0.9999 7 0.3 0.5,0.78% 7 0.8 Table IV Results from Accuracy/recovery studies Level of addition (%) 80 100 120 80 100 120 Amount Added 20 25 30 4 5 6 %Recovery ± S.D. 99.6±0.75 100.3±0.27 98.1±0.36 99.6±0.79 99.9±0.53 100.3±0.98 Drug Component Target Concentration %RSD 0.76 0.27 0.36 0.79 0.53 0.98 3TC 25 d4T 5 The chromatographic conditions were finally optimized on Kromasil C8 column (5 µm, 250 mm length X 4.6 mm i.d.) with gradient elution of mobile phase composed of acetonitrile and ammonium acetate buffer (0.02M, pH-4.5 adjusted with acetic acid) at flow rate of 1 ml/min. Under these conditions, peaks of 3TC, and d4T were well-defined and free from tailing (Fig. 2). 205
R. Nageswara Raoet al ______________________________________________________________________________ J. Chem. Pharm. Res., 2011, 3(6):200-211 Method Validation The analytical method was validated with respect to parameters such as linearity, limit of quantitation (LOQ), limit of detection (LOD), precision, accuracy, specificity, robustness and system suitability as per ICH guideline [34]. Table V Results from determination of precision of proposed method Day of analysis %Recovery±SD; %RSD Intraday Precision 3TC (in µg/ml) 20 Day 0 100.2±0.10; 0.10 100.0±0.18; 0.18 100.2±0.86; 0.86 Day 1 100.6±1.03; 1.02 101.2±0.70; 0.70 Day 2 100.2±0.54, 0.54 101.4±0.64; 0.63 100.9±1.05; 1.04 d4T (in µg/ml) 4 Day 0 100.0±0.17; 0.17 100.1±1.00; 0.94 Day 1 99.1±0.67; 0.67 Day 2 99.1±0.67; 0.68 Interday Precision 3TC (inµg/ml) 20 Day 0,1,2 100.4±0.24; 0.24 100.5±0.62; 0.62 100.3±0.57; 0.56 d4T (inµg/ml) 4 Day 0,1,2 99.4±0.53; 0.53 Table VI Results from Robustness studies Level of addition (%) 0.015 0.020 0.025 4.4 4.5 4.6 0.9 1.0 1.1 Phenomenex Kromasil 25 30 99.8±0.64; 0.64 5 6 99.3±0.07; 0.07 101.8±0.68; 0.67 101.5±0.55; 0.54 101.0±1.00; 1.00 100.3±0.34; 0.34 25 30 5 6 101.0±0.83; 0.82 100.4±1.08; 1.08 %Recovery±SD; %RSD 3TC 98.4±0.12; 0.12 100.0±0.18; 0.18 101.8±0.43; 0.42 98.8±0.56; 0.57 99.5±0.58; 0.58 100.5±0.72; 0.72 101.7±0.21; 0.21 100.4±0.76; 0.76 98.6±1.11; 1.13 100.4±0.79; 0.79 100.9±1.01; 1.01 99.8±1.06; 1.06 100.0±0.25; 0.25 99.9±0.77; 0.77 Method Parameters d4T 101.0±0.63; 0.63 Buffer Concentration(M) 100.1±0.58; 0.58 101.7±0.16; 0.16 99.5±0.51; 0.51 Buffer pH 100.7±0.71; 0.71 Flow rate (mL/min) 101.7±0.97; 0.95 99.5±1.19; 1.20 100.0±0.14; 0.14 RP C-8 column Fig.2 A typical chromatogram of Tablet solution 206
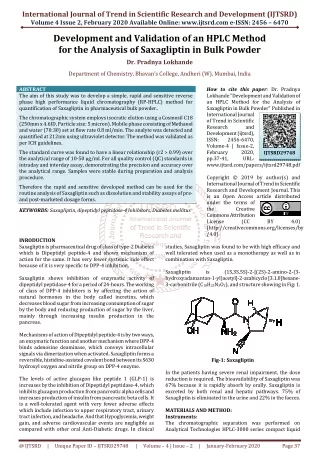
R. Nageswara Raoet al ______________________________________________________________________________ J. Chem. Pharm. Res., 2011, 3(6):200-211 (a) (b) (c) (d) (e) Fig.3 Typical chromatograms of Tablet solution after (a) Acid degradation (b) Base degradation (c) Neutral degradation (d) Oxidative degradation (e) Photolysis 207
R. Nageswara Raoet al ______________________________________________________________________________ J. Chem. Pharm. Res., 2011, 3(6):200-211 Forced degradation studies/Specificity The optimized RP-HPLC method was used to study degradation behaviour of the drugs in both bulk drugs and combined tablet dosage forms under various stress conditions. It was suggested to target degradation of 20–80% when establishing the stability-indicating properties of analytical methods, because even intermediate degradation products should not interfere with any stage of drug analysis [40]. Although conditions used for forced degradation were adjusted to achieve degradation in this range, this could not be achieved for conditions other than exposure to hydrolytic and oxidizing agent, even after long exposure. The mass balance of Stavudine and Lamivudine under each stress condition was found 100% and, moreover, assay of each unaffected compound in the tablets confirmed the stability- indicating nature of the method. 3TC was relatively more labile than d4T in basic hydrolytic conditions while d4T was more susceptible than 3TC in acidic, neutral, oxidative stress conditions. Stavudine (d4T) was more labile to photolytic stress conditions than 3TC. The results from forced degradation studies are summarized in Table II. Representative Chromatograms obtained from forced degradation studies are shown in Fig. 3.The degradation behavior and degradation products of 3TC and d4T were found to be similar in combination drug product and in bulk drugs under various stress conditions assessed. The study was not intended to identify degradation products but merely to show they would not interfere if and when present. To conclude, the results of stress testing studies indicate a high degree of specificity of this method for both 3TC and d4T. Linearity, LOD and LOQ The calibration plot was linear over the concentration range investigated (2.5–50 µg/ml; n = 3) and (0.5-10 µg/ml; n = 3) for 3TC and d4T respectively. Average correlation coefficient r=0.9999 for both drug candidates with RSD values ≤2.0%, across the concentration ranges studied, was obtained from regression analysis. The LOQ that produced the requisite precision and accuracy was found to be 2.5 µg/ml for 3TC and 0.5 µg/ml for d4T. The resultant %RSD values were ≤1.00%.The LOD for lamivudine and stavudine were found to be 0.8 µg/ml and 0.3 µg/ml respectively. The results from regression line analysis are tabulated in Table III. The regression results indicate that method was linear in the concentration range studied and can be used for detection and quantification of 3TC and d4T in a very wide concentration range. Accuracy and Precision Accuracy as recovery was evaluated by spiking previously analysed test solution with additional standard drug at three different concentration levels. Recovery of standard drugs added was found to be 99.32±1.10% for lamivudine and 99.93±0.23% for stavudine with the value of RSD less than 1% (Table IV) indicating that the proposed method is accurate for the simultaneous estimation of both drugs from their combination drug products in presence of their degradation products. The RSDs for intra-day and inter-day precision were not more than 1.5% for both 3TC and d4T (Table V). The low RSD values indicate the repeatability and reproducibility of the method. Robustness Results of the robustness study are depicted in Table VI. The elution order and resolution for both components were not significantly affected. RSD of peak areas were found to be well within the limit of 2.0%. 208
R. Nageswara Raoet al ______________________________________________________________________________ J. Chem. Pharm. Res., 2011, 3(6):200-211 Assay of Commercial Tablets The validated method was applied to determine lamivudine and stavudine in commercially available drug products. The results of the assays (n = 6) undertaken yielded 100.71% ± 0.80 (RSD = 0.79%) and 99.91% ± 0.64 (RSD = 0.64%) of label claim for 3TC, and D4T, respectively. The mean tR of 3TC, and d4T were 13.66 and 16.51 min with associated RSD values of 0.16 and 0.30 %. The result indicates that the method is selective for the routine analysis of 3TC, and d4T with no chromatographic interference from impurities. Solution stability The stock solution showed no significant change in analyte composition, retention time and peak areas of 3TC and d4T after 2 weeks of storage at 4oC. The recoveries were found to be 101.43 ± 0.3% and 99.03±1.3% (±%RSD) for 3TC and d4T respectively, without any traceable degradation. Similarly, the standard solutions of both 3TC and d4T were found to be stable at room temperature over a 48 hr period which was sufficient for the whole analytical process. CONCLUSION A simple, rapid, accurate and precise stability-indicating HPLC analytical method has been developed and validated for the routine quantitative analysis of lamivudine and stavudine in API and combined dosage forms. The results of stress testing undertaken according to the ICH guidelines reveal that the method is specific and stability-indicating. The proposed method has the ability to separate these drugs from their degradation products in tablet dosage forms and hence can be applied to the analysis of routine quality control samples and samples obtained from stability studies. Acknowledgments The authors wish to thank faculty of NIPER, Hyderabad and research fellows of analytical chemistry devision of Indian institute of technology, hyderabad for wholeheartedly supporting this work. REFERENCES [1] J. A. Coates, N. Cammack, H. J. Jenkinson, A. J. Jowett, M. I. Jowett, B. A. Pearson, C. R. Penn, P. L. Rouse, K. C. Viner, J. M. Cameron, J Antimicrob Chemother., 36, 733 (1992) [2] J.M. Pluda, T.P. Cooley, J.S. Montaner, L.E. Shay, N.E. Reinhalter, S.N. Warthan, J. Ruedy, H.M. Hirst, C.A. Vicary, J.B. Quinn, J Infect Dis, 171, 1438 (1995) [3] J.L. Dienstag, R.P. Perrillo, E.R. Schiff, M. Bartholomew, C. Vicary, M. Rubin, New Engl. J Med, 333, 1657 (1995) [4] AHFS Drug Information, 2008, pp. 744-746 [5] B.A. Larder, S.D. Kemp, P.R. Harrigan, Science, 269, 696 (1995) [6] D.D. Richman, J.M. Grimes, S.W. Lagakos, J acquir immune Defic Syndr., 3, 743 (1990) [7] Guidelines for the Use of Antiretroviral Agents in HIV Infected Adults and Adolescents, US Department Of Health And Human Services, January 10, 2011 [8] N. Kaul, H. Agrawal, A. R. Paradkar, K. R. Mahadik, Chromatographia, 60, 213 (2004) [9] G. Bedse, V. Kumar; S. Singh, Journal of Pharmaceutical and Biomedical Analysis, 49, 55 (2009) [10]http://www.who.int/medicines/publications/pharmacopoeia/QAS_124rev2Lamivudine.mono FINAL.pdf [11] P. J. Wagh, N. Pai, Indian Drugs, 39, 654 (2002) [12] P. Djurdjevic, A. Laban, S. Markovic, M. Jelikic-Stankov, Anal. Lett. 37, 2649 (2004) 209
R. Nageswara Raoet al ______________________________________________________________________________ J. Chem. Pharm. Res., 2011, 3(6):200-211 [13] G. Bahrami, S. Mirzaeei, A. Kiani, B. Mohammadi, J. Chromatogr. B: Analyt. Technol. Biomed. Life Sci., 823, 213 (2005) [14] X.J. Zhou, J.P. Sommadossi, Journal of Chrom. B: Biomedical Sciences and Applications, 691, 417 (1997) [15] B. Jayakar. B, M. Kumar, C. Saravanan , M. V. Kumudhavalli, J. Chem. Pharm. Res., 2(1): 478 (2010). [16] J. Nijamdeen, B. Jayalakshmi, N. Senthilkumar, Vijayamirtharaj C. Saravanan, J. Chem. Pharm. Res., 2(3):92 (2010). [17] A. S. Pereira, K. B. Kenney, M. S. Cohen, J. E. Hall, J. J. Eron, R. R. Tidwell, J. A. Dunn, Journal of Chrom. B: Biomedical Sciences and Applications,742, 173 (2000) [18] Q. Zheng, X. Li, J. Jiang, B. Hu, Yaowu Fenxi Zazhi, 25, 73 (2005). [19]D.K.Mandloi, P.K.Tyagi, V.K.Rai, S. Dey, R.K Ashada, P.Mohanraj, J. Chem. Pharm. Res., 1(1): 286 (2009). [20]T.Sudha, J.Saminathan, KondapalliAnusha, ManthenaKeerthi, YanamadalaBhargavi, Ganesan.V, J. Chem. Pharm. Res., 2(5): 45 (2010). [21] N. Kaul, H. Agrawal, A.R. Paradkar, K.R. Mahadik, Journal of Chromatographic Science, 43, 406 (2005) [22] A. Dunge, N. Sharda, B. Singh, S. Singh, Journal Of Pharmaceutical and Biomedical Analysis, 37, 1115 (2005) [23]http://www.who.int/medicines/publications/pharmacopoeia/QAS_123rev2_Stavudine_mono _FINAL07.pdf [24] G. Aymard, M. Legrand, N. Trichereau,B. Diquet, Journal of Chrom. B: Biomedical Sciences and Applications, 744, 227 (2000) [25] S. Kaul, K.A. Dandekar, K.A. Pittman, Pharm. Res. 6, 895 (1989) [26]. M. Sarasa, N. Riba, L. Zamora, X Carne, Journal of Chrom. B: Biomedical Sciences and Applications, 746, 183 (2000) [27] J.S. Janiszewski, D.E. Mulvana, S. Kaul, K.A. Dandekar, R.H. Barbhaiya, J Chromatogr., 577, 151 (1992) [28] S.L. Wong, R.J. Sawchuk, Pharm. Res. 8, 619 (1991) [29] F. Becher, A. Pruvost, C. Goujard, C. Guerreiro, J.F. Delfraissy, J. Grassi, H. Benech, Rapid Commun. Mass Spectrom. 16, 555 (2002) [30] N. Kapoor, S. Khandavilli, R. Panchagnula, J Pharm. Biomed. Anal., 41,761 (2006) [31] Ch.Balasekar reddy, B. Z. Awen, Ch. B. Rao, N.Sreekanth, P.Ramalingam, an International Journal of Advances in Pharmaceutical Sciences,1, 22 (2010) [32] P.K. Saini, R.M. Singh, C.L. Jain, S.C. Mathur, G. N. Singh. Journal of Pharmacy Research, 2, 1598 (2009) [33] S.Jayaseelan, S.Ganesh, M.Rajasekar, V.Sekar, P.Perumal,International Journal of Pharm.Tech. Research,2, 1539 (2010) [34] ICH, Q1A (R2): Stability Testing Of New Drug Substances and Products, International Conference on Harmonization Inter February 2003 [35] FDA, Guidance for Industry: Stability Testing Of Drug Substances and Drug Products (Draft Guidance), Food and Drug Administration, Rockville, MD, November 2003 [36] CPMP, Note for Guidance on Stability Testing Of Existing Active Substances and Related Finished Products. Committee for Proprietary Medicinal Products, EMEA, London, March 2003 [37] ICH, Q1 B: Photostability Testing Of New Drug Substances and Products Q1B, International Conference on Harmonization, November 1996 [38] ICH Q2 (R1): Validation of Analytical Procedures: Text and Methodology, International Conference on Harmonisation, November 2005 [39] S. Ahuja, S. Scypinski S, Handbook of modern pharmaceutical analysis. Academic press, New York, 2001, pp. 415–443 210
R. Nageswara Raoet al ______________________________________________________________________________ J. Chem. Pharm. Res., 2011, 3(6):200-211 [40] M.Bakshi, and S.J.Singh, J Pharm. Biomed. Anal., 28, 1011, (2002) 211