Download
1 / 4
40 likes | 108 Views
A simple, rapid UV Visible spectrophotometric method for the quantification of Pioglitazone hydrochloride and Glimepiride in bulk drug and tablet formulation was developed and validated. UV Visible spectrophotometric methods have been developed for the Derivative Spectrophotometric Method, of Pioglitazone and glimepiride in bulk and pharmaceutical dosage forms. the sampling wavelengths selected are 210 nm and 218 nm over the concentration ranges of 1.5 7.5 u00c2u00b5g ml and 0.2 1.0 u00c2u00b5g ml for pioglitazone and glimepiride respectively. Tejaswini Kande | Pallavi Dhekale | Supriya Khatal | Priyanka Borude "Development and Validation of Analytical Methods for Simultaneous Spectrophotometric Determination of Pioglitazone and Glimepiride by Derivative Method" Published in International Journal of Trend in Scientific Research and Development (ijtsrd), ISSN: 2456-6470, Volume-4 | Issue-1 , December 2019, URL: https://www.ijtsrd.com/papers/ijtsrd29699.pdf Paper URL: https://www.ijtsrd.com/pharmacy/analytical-chemistry/29699/development-and-validation-of-analytical-methods-for-simultaneous-spectrophotometric-determination-of-pioglitazone-and-glimepiride-by-derivative-method/tejaswini-kande<br>

E N D
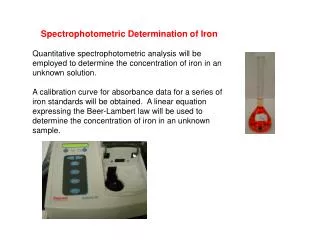
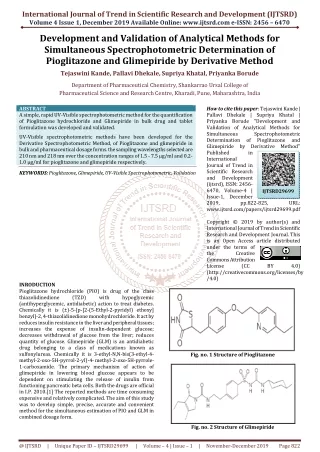
International Journal of Trend in Scientific Research and Development (IJTSRD) Volume 4 Issue 1, December 2019 Available Online: www.ijtsrd.com e-ISSN: 2456 – 6470 Development and Validation of Analytical Methods for Simultaneous Spectrophotometric Determination of Pioglitazone and Glimepiride by Derivative Method Tejaswini Kande, Pallavi Dhekale, Supriya Khatal, Priyanka Borude Department of Pharmaceutical Chemistry, Shankarrao Ursal College of Pharmaceutical Science and Research Centre, Kharadi, Pune, Maharashtra, India ABSTRACT A simple, rapid UV-Visible spectrophotometric method for the quantification of Pioglitazone hydrochloride and Glimepiride in bulk drug and tablet formulation was developed and validated. UV-Visible spectrophotometric methods have been developed for the Derivative Spectrophotometric Method, of Pioglitazone and glimepiride in bulk and pharmaceutical dosage forms. the sampling wavelengths selected are 210 nm and 218 nm over the concentration ranges of 1.5 - 7.5 μg/ml and 0.2- 1.0 μg/ml for pioglitazone and glimepiride respectively. KEYWORDS: Pioglitazone, Glimepiride, UV-Visible Spectrophotometric, Validation How to cite this paper: Tejaswini Kande | Pallavi Dhekale | Supriya Khatal | Priyanka Borude "Development and Validation of Analytical Methods for Simultaneous Determination of Glimepiride by Derivative Method" Published in International Journal of Trend in Scientific Research and Development (ijtsrd), ISSN: 2456- 6470, Volume-4 | Issue-1, December 2019, pp.822-825, www.ijtsrd.com/papers/ijtsrd29699.pdf Copyright © 2019 by author(s) and International Journal of Trend in Scientific Research and Development Journal. This is an Open Access article distributed under the terms of the Creative Commons Attribution License (CC (http://creativecommons.org/licenses/by /4.0) Spectrophotometric Pioglitazone and IJTSRD29699 URL: BY 4.0) INRODUCTION Pioglitazone hydrochloride (PIO) is drug of the class thiazolidinedione (TZD) (antihyperglycemic, antidiabetic) action to treat diabetes. Chemically it is (±)-5-[p-[2-(5-Ethyl-2-pyridyl) ethoxy] benzyl]-2, 4-thiazolidinedione monohydrochloride. It act by reduces insulin resistance in the liver and peripheral tissues; increases the expense of insulin-dependent glucose; decreases withdrawal of glucose from the liver; reduces quantity of glucose. Glimepiride (GLM) is an antidiabetic drug belonging to a class of medications known as sulfonylureas. Chemically it is 3-ethyl-N,N-bis(3-ethyl-4- methyl-2-oxo-5H-pyrrol-2-yl)-4- methyl-2-oxo-5H-pyrrole- 1-carboxamide. The primary mechanism of action of glimepiride in lowering blood glucose appears to be dependent on stimulating the release of insulin from functioning pancreatic beta cells. Both the drugs are official in I.P. 2010.[1] The reported methods are time consuming expensive and relatively complicated. The aim of this study was to develop simple, precise, accurate and convenient method for the simultaneous estimation of PIO and GLM in combined dosage form. with hypoglycemic Fig. no. 1 Structure of Pioglitazone Fig. no. 2 Structure of Glimepiride @ IJTSRD | Unique Paper ID – IJTSRD29699 | Volume – 4 | Issue – 1 | November-December 2019 Page 822
International Journal of Trend in Scientific Research and Development (IJTSRD) @ www.ijtsrd.com eISSN: 2456-6470 MATERIALS AND METHODS Pioglitazone and glimepiride were obtained as gift samples from Lupin Pharmaceutical pune MATERIALS AND METHODS: Table no.1 List of Instruments / equipments Sr. No. Equipment 1. spectrometry Corporation to 10 ml to get the concentrations 0.20, 0.40, 0.60, 0.80 and 1.0 µg/ml. Similarly, from working standard solution of Pioglitazone 1.5, 3, 4.5, 6, and 7.5 ml were pipette out and each was diluted to 10 ml to get the concentrations 1.50, 30, 4.50, 60, and 7.50 µg/ml. The absorbance of each of this solution was measured at selected wavelengthss and plotted against concentration. The concentration range over which the drug obeyed Beer’s law was chosen. The range was found to be 0.20-1.0 µg/ml for Glimepiride for (r2 = 0.998) and 1.50-7.50 µg/ml for Pioglitazone (r2 = 0.995) Analysis of powder mixture8,9 By using working standard solutions of Pioglitazone and Glimepiride, further dilutions were made to get Pioglitazone and Glimepiride in concentration of 10 µg/ml. The absorbance of this Pioglitazone and Glimepiride mixture was measured at 218 nm by using formula. Procedure for analysis of tablet formulation9 Twenty tablets were weighed accurately and powdered. Powder equivalent to 50 mg pioglitazone was weighed and transferred to 50 ml volumetric flask; in the same flask 50 mg of pure Glimipiride drug was added and dissolved in methanol by shaking the flask for 10 minutes. The solution was scanned in the range of 200-400 nm against blank to obtain spectra and the first derivative spectra of the resulting solution was recorded, dA/dλmeasured at wavelength 218 nm and the concentrations of both drugs were determined using the equation Procedure for Recovery Studies10,11 Recovery studies were carried out by applying the method to drug sample present in tablet dosage form to which known amount of pioglitazone and glimipiride corresponding to 80,100,120% of pioglitazone and Glimipiride was added (standard addition method). In 80% recovery study amount of standard added was 1.20 mg of pioglitazone. In 100 % recovery study the amount of standard added was 1.50 mg of pioglitazone. In 120 % recovery study the amount of pioglitazone standard added was 1.80 mg. In 80% recovery study the amount of Glimipiride standard added was 0.16 mg. In 100 % recovery study the amount of standard added was 0.20 mg of Glimipiride In 120 % recovery study the amount of Glimipiride standard added was 0.24 mg. The mixed sample solutions were analyzed to obtain spectra and absorbance value at 218 nm (λ max of Pioglitazone and Glimipiride respectively) were noted. The concentration of pioglitazone and Glimipiride were calculated from the equation. At each levels of the amount of three determinations were performed and results obtained was compared with expected results. Instrument / Make Model UV Shimadzu UV-1800 240V BL-22OH (Electronic balance) Weighing Balance Shimadzu Corporation 2. Table no.2 Apparatus and Glass wares Sr. No. 1. 2. Glass wares Make Volumetric flasks (25 ml) Beaker Measuring Cylinder (250 ml, 1000 ml, 2000 ml) BOROSIL, INDIA BOROSIL, INDIA 3. BOROSIL, INDIA MARKETED FORMULATION AVAILABLE: Brand Name: PIOGLAR-G Manufactured by: RANBAXY Labeled claim: Pioglitazone – 15 mg Glimepiride – 2 mg REAGENTS AND CHEMICALS: All reagents and chemicals used were of AR analytical grade. - Methanol Simultaneouse spectrophotometric determination of Pioglitazone and Glimepiride by DerivativeMethod. Preparation of standard stock solution5-8 The standard stock solutions of Pioglitazone and Glimepiride were prepared by dissolving separately 10 mg of drug each in 100 ml methanol. Aliquots of working stock solutions of both were diluted with methanol solution. Selection of sampling wavelengths for analysis7 Appropriate dilutions were made with methanol to give concentration of 10 µg/ml. Further the solution was scanned in UV range from 200-400 nm and the spectrum was recorded. From the spectrum, wavelengths chosen were for Pioglitazone (210 nm) and Glimepiride (218 nm) Selection of Analytical Concentration Range and Preparation of Calibration Curves. From working standard solution of Glimepiride 0.02, 0.04, 0.06, 0.08 and 0.10 ml were pipette out and each was diluted Formulae for determination of concentration of pioglitazone and glimipiride using Derivative Method The concentration of drug was then calculated by using following equation. C Pio = d/dλ [APio/AGlim] – Intercept[C Slope C Glim = d/dλ [Glim/Pio] – Intercept[C Slope CPio = dA/dλ (at 210 nm) - 0.0005 0.0028 @ IJTSRD | Unique Paper ID – IJTSRD29699 | Volume – 4 | Issue – 1 | November-December 2019 Page 823
International Journal of Trend in Scientific Research and Development (IJTSRD) @ www.ijtsrd.com eISSN: 2456-6470 CGlim = dA/dλ (at 218 nm) - 0.225 0.575 Table No.3 Data of powder mixture Analysis Amount present in (μg/ml) Amount found in (μg/ml) Amount found in % Glim Pio Glim 0.20 1.50 0.18 0.20 1.50 0.19 0.20 1.50 0.18 0.20 1.50 0.19 0.20 1.50 0.18 Analysis of tablet formulation9,10 The solution was scanned in the range of 200-400 nm against blank to obtain spectra and the first derivative spectra of the resulting solution was recorded, dA/dλmeasured at wavelength 218 nm and the concentrations of both drugs were determined using the equation Table No.4 Analysis of Tablet Formulation Sr. No. Glim Pio Glim 1. 0.20 1.50 0.19 2. 0.20 1.50 0.19 3. 0.20 1.50 0.18 4. 0.20 1.50 0.19 5. 0.20 1.50 0.19 Table No.5: Statistical analysis of tablet formulation Component Mean Standard Deviation Co-efficient of Variation Standard Error Pioglitazone 94.00 1.236068 Glimepiride 98.66 0.470234 Recovery Studies13-15 The mixed sample solutions were analyzed to obtain spectra and absorbance value at 218 nm (λ max) of Pioglitazone and Glimipiride respectively) were noted. The concentration of pioglitazone and Glimipiride were calculated from the equation. At each levels of the amount of three determinations were performed and results obtained was compared with expected results. Table No.6 Recovery studies of Pioglitazone and Glimipiride Added concentration Ug/ml Pio 210nm 80 1.50 0.20 1.20 0.16 0.756 80 1.50 0.20 1.20 0.16 0.757 80 1.50 0.20 1.20 0.16 0.756 100 1.50 0.20 1.50 0.20 0.887 100 1.50 0.20 1.50 0.20 0.888 100 1.50 0.20 1.50 0.20 0.889 120 1.50 0.20 1.80 0.24 0.741 120 1.50 0.20 1.80 0.24 0.742 120 1.50 0.20 1.80 0.24 0.743 Table No.7 Statistical analysis of Tablet Formulation Level of percentage recovery Recovery Deaviation Pio Glim Pio Glim 80 97.72 91.66 1.273303 1.608439 100 95.66 92.22 0.57735 1.886751 120 95.7 93.05 0.259808 1.407551 Sr. No. 1. 2. 3. 4. 5. Pio 1.48 1.47 1.48 1.49 1.48 Glim 90 95 90 95 90 Pio 98.66 98 98.66 99.33 98.66 Label Claim (μg/ml) Amount Found (μg/ml) % of Label Claim Pio 1.47 1.48 1.48 1.49 1.48 Glim 95 95 90 95 95 Pio 98 98.66 98.66 99.33 98.66 1.3787 0.4766 0.689739 0.308739 Total absorbance ug/ml Conc.recoverd Ug/ml Percentage of recovery Preanalysed Level of % recovery Glim 218nm 0.516 0.517 0.518 0.600 0.601 0.602 0.505 0.506 0.507 Pio Glim Pio Glim Pio Glim Pio Glim 1.15 1.17 1.18 1.43 1.44 1.43 1.72 1.76 1.78 0.15 0.14 0.15 0.18 0.19 0.18 0.22 0.23 0.22 95.83 97.5 98.33 95.33 96.33 95.33 95.55 96.00 95.55 93.75 87.5 93.75 90.00 95.00 90.00 91.66 95.83 91.66 % Mean Standard Co –efficient of variation Pio 1.303011 0.604175 0.271473 Standard Error Glim 1.936765 1.13028 1.587373 Pio Glim 0.8995 0.69904 0.128407 0.759836 0.509714 0.551628 @ IJTSRD | Unique Paper ID – IJTSRD29699 | Volume – 4 | Issue – 1 | November-December 2019 Page 824
International Journal of Trend in Scientific Research and Development (IJTSRD) @ www.ijtsrd.com eISSN: 2456-6470 Table No.8 Precision studies for Pioglitazone Measured area (µg/ml) ± S.D, RSD (%) Repeatability (n=2) 1.20 1.27 ± 0.015275, 1.20 1.50 1.42 ± 0.0057, 0.40 1.80 1.78 ± 0.01, 0.42 Sr. No. Conc. µg/ml Intermediate Precision (n=2) 1.20± 0.012190, 0.95 1.47 ± 0.0045, 0.32 1.42 ± 0.01, 0.056 1 2 3 Table No.9 Precision studies for Glimepiride Measured area (µg/ml) ± S.D, RSD (%) Repeatability (n=2) Intermediate Precision (n=2) 0.16 0.14 ± 0.01211, 9.36 0.20 0.17 ± 0.01154., 6.79 0.24 0.24 ± 0.00763, 3.1 Sr. No. Conc. µg/ml 1 2 3 0.14 ± 0.01311, 9.36 0.17 ± 0.01142, 6.71 0.24 ± 0.0072, 3.01 CONCLUSION: The developed UV method like derivative method are precise, specific, and accurate. Statistical analysis proves that these methods are suitable for the analysis of Pioglitazone and Glimepiride in bulk and pharmaceutical formulation without any interference from the excipient. These methods have been found to be better than previously reported methods, because of use of less, economical and readily available solvent like methanol. REFERENCES: [1]Jane Kelly.CDC. http://www.cdc.gov/diabetes/index.htm [10]Mishra D., Sahu K.C. and Pradhan K.K., “Method development and validation of pioglitazone in bulk by UV spectrophaotometric method”, Inventi Rapid: Pharm Analysis and Quality Assurance , vol.1(1), 2011; p.226-234. [11]Kommana R. and Rebecca S.D., “Development and validation of UV spectrophotometric method for determination of pioglitazone hydrochloride in bulk and its formulations”, Der Pharmacia Lettre, vol.5 (1), 2013; p. 269-278. Diabetes. Web sites: [12]Pavia D. L, Gary M. L., James A., George S. K., “Ultraviolet spectroscopy”, Introduction to spectroscopy, 4th ed. Cengage Learning; 2009; p.381-417 [2]Tripathi KD. Chapter 19: Insulin, Oral Hypoglycaemic Drugs and Glucagon. pharmacology.17th Ed.New Delhi: Jaypee; 2013:701- 05. Essentials of medical [13]Sharma B. K., “Ultraviolet and Visible spectroscopy”, Instrument method of chemical analysis, 23rd ed. Krishna prakashan media; 2004; p.68-192. [3]Hossain et al. “A Validated RP-HPLC Method for Simultaneous Estimation of Antidiabetic Drugs Pioglitazone HCl and Glimepiride” Bangladesh Pharmaceutical Journal 16(1), 2013: 69-75. [14]Chandanam S., Manogna K, Sreenivasa R. T., Akamma H. G., Sukanya K. and Shakir V. K., “New analytical method development and validation of pioglitazone by Uv spectrophotometry”, Pharmaceutical, Biological and Chemical Sciences, vol.3(4), 2012; p.20-29. Research Journal of [4]D. Boopathy et al. “Method development and validation of Simultaneous determination of pioglitazone And Glimepiride in pharmaceutical dosage Form by RP- HPLC”, Int. J. ChemTech Res.2010,2(1): 50-53. [15]Kulkarni A. P., Shahnawaz M., Zahid Z., Dehgan M. H., “Spectroscopic Estimation Hydrochloride,” Global Research,vol12(2), 2012;p.1-7 of Pioglitazone of Medicinal [5]Jain S, Goel R. Spectrophotometric Determination of Glimepiride and Pioglitazone-Hydrochloride In Bulk and Tablet Dosage Form By Absorption Ratio Method. Asian Journal of Biochemical and Pharmaceutical Research Issue 2 (Vol. 4) 2014:1-7. Journal [16]Rajeshri D. Chaudhari*1, Vishruti H. Choksi1, Tanvi Divan1, Bhavna A. Patel1, Shraddha J. Parmar1, “Development And Validation Of First Order Derivative Spectrophotometric Method For Estimation Of Lacosamide In Bulk And Tablet Dosage Form”, Asian J Pharm Clin Res, Vol 6, Suppl 3, 2013, 162-164. [6]Gulve SA, Tarkase K N, Mundhe D B., Hajare PP. Development and validation spectrophotometric method for estimation of pioglitazone HCl and glimepiride in bulk and combine dosage form. Der Pharma Chemica, 2013, 5(3):122- 127. of derivative [17]Ranjale Amol Rangnath, Jain Hemant Kumar, Gujar Kishore Namdeorao, “Development and Validation For Uv Spectrometric Estimation Hydrochloride In Bulk and Tablet Dosage Form Using Area Under Curve Method”, Int. Res. J. Pharm. 2014, 5 (7), 580-583. Of Ambroxol [7]Vijay Vikram Singh, Partha Chaudhary, Hema B, Richa Tiwari, Method development of Pioglitazone by UV Spectrophotometer, international journal of drug development and research [18]Tushar K. Kadia, Darshil B. Shah, Dr.Dilip G.M., “Development And Validation Of Q-Absorbance Ratio Spectrophotometric Method Estimation Of Cilnidipine And Metoprolol Succinate In Bulk And Combined Dosage Form” Int J Pharm Pharm Sci, Vol 6, Issue 6, 401-407 [8]Alsante KM, Ando A, Brown R (2007) The role of degradant profiling ingredients and drug products. Adv Drug Deliv Rev 59(1): 29-37. in active pharmaceutical For Simultaneous [9]Farah Iram, Huma Iram, Forced Degradation Studies, Journal of Analytical & Pharmaceutical Research Volume 3, Issue 6 – 2016. @ IJTSRD | Unique Paper ID – IJTSRD29699 | Volume – 4 | Issue – 1 | November-December 2019 Page 825