Download
1 / 7
80 likes | 162 Views
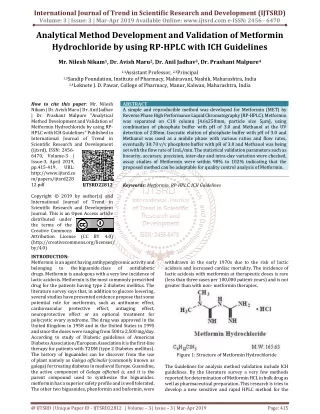
In this work the authors have proposed a simple, specific, economic and accurate reverse phase liquid chromatographic method for the estimation of Zolmitriptan as an active pharmaceutical ingredient and in pharmaceutical formulation. The main objective of the current research paper is to To develop simple, precise and accurate RP HPLC method for Zolmitriptan also to validate the developed method as per ICH guideline Q2R1 and to explore the applicability of the method in finished product formulation for estimation of Zolmitriptan during its lifecycle. The objective was achieved by optimized condition with Phonemenex C18 column 150mmu00c3u20144.6mm , 5u00c2u00b5m. And mobile phase Phosphate buffer pH 3.5 85 Methanol 15. The separation was done with a flow rate of 0.9ml min, detection with 224nm. The retention was found to be 3.57 minute. LOD and LOQ were found to be 2.45 and 7.42 respectively. So in order to obtain the correct results various validations methods are performed to get the results. The results obtained from those validation methods are plotted in the form of the charts as well as the different curves. Mr. Rahul M. Sagde | Mr. Pawan N. Karwa | Mr. Vivek M. Thorat | Sanjay S. Jadhav "Analytical Method Development and Validation for the Estimation of Zolmitriptan by RP HPLC Method" Published in International Journal of Trend in Scientific Research and Development (ijtsrd), ISSN: 2456-6470, Volume-3 | Issue-5 , August 2019, URL: https://www.ijtsrd.com/papers/ijtsrd26474.pdf Paper URL: https://www.ijtsrd.com/pharmacy/analytical-chemistry/26474/analytical-method-development-and-validation-for-the-estimation-of-zolmitriptan-by-rp-hplc-method/mr-rahul-m-sagde<br>

E N D
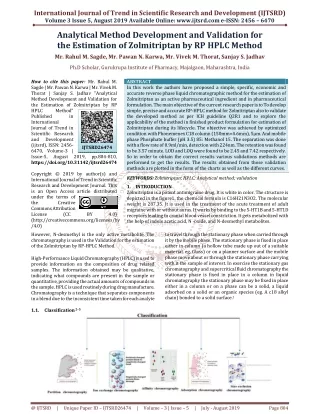
International Journal of Trend in Scientific Research and Development (IJTSRD) Volume 3 Issue 5, August 2019 Available Online: www.ijtsrd.com e-ISSN: 2456 – 6470 Analytical Method Development and Validation for the Estimation of Zolmitriptan by RP HPLC Method Mr. Rahul M. Sagde, Mr. Pawan N. Karwa, Mr. Vivek M. Thorat, Sanjay S. Jadhav Ph.D Scholar, Gurukrupa Institute of Pharmacy,Majalgaon, Maharashtra, India How to cite this paper: Mr. Rahul M. Sagde | Mr. Pawan N. Karwa | Mr. Vivek M. Thorat | Sanjay S. Jadhav "Analytical Method Development and Validation for the Estimation of Zolmitriptan by RP HPLC Method" Published in International Journal of Trend in Scientific Research and Development (ijtsrd), ISSN: 2456- 6470, Volume-3 | Issue-5, August 2019, pp.804-810, https://doi.org/10.31142/ijtsrd26474 Copyright © 2019 by author(s) and International Journal of Trend in Scientific Research and Development Journal. This is an Open Access article distributed under the terms of the Creative Commons Attribution License (CC BY 4.0) (http://creativecommons.org/licenses/by /4.0) However, N-desmethyl is the only active metabolite. The chromatography is used in the Validation for the estimation of the Zolmitriptan by RP-HPLC Method. High-Performance Liquid Chromatography (HPLC) is used to provide information on the composition of drug related samples. The information obtained may be qualitative, indicating what compounds are present in the sample or quantitative, providing the actual amounts of compounds in the sample. HPLC is used routinely during drug manufacture. Chromatography is a technique that separates components in a blend due to the inconsistent time taken for each analyte 1.1.Classification 2–5 ABSTRACT In this work the authors have proposed a simple, specific, economic and accurate reverse phase liquid chromatographic method for the estimation of Zolmitriptan as an active pharmaceutical ingredient and in pharmaceutical formulation. The main objective of the current research paper is to To develop simple, precise and accurate RP-HPLC method for Zolmitriptan also to validate the developed method as per ICH guideline Q2R1 and to explore the applicability of the method in finished product formulation for estimation of Zolmitriptan during its lifecycle. The objective was achieved by optimized condition with Phonemenex C18 column (150mm×4.6mm), 5μm. And mobile phase Phosphate buffer (pH 3.5) 85: Methanol 15. The separation was done with a flow rate of 0.9ml/min, detection with 224nm. The retention was found to be 3.57 minute. LOD and LOQ were found to be 2.45 and 7.42 respectively. So in order to obtain the correct results various validations methods are performed to get the results. The results obtained from those validation methods are plotted in the form of the charts as well as the different curves. KEYWORDS: Zolmitriptan; HPLC; Analytical method; validation 1.INTRODUCTION Zolmitriptan is a potent antimigraine drug. It is white in color. The structure is depicted in the figure1. the chemical formula is C16H21N3O2. The molecular weight is 287.35. It is used in the treatment of the acute treatment of adult migraine with or without auras.It works by binding to the 5-HT1B and 5-HT1D receptors leading to cranial blood vessel constriction. It gets metabolized with the help of indole acetic acid, N -oxide, and N-desmethyl metabolites. IJTSRD26474 to travel through the stationary phase when carried through it by the mobile phase. The stationary phase is fixed in place either in column (a hollow tube made up out of a suitable material, eg. Glass) or on a planner surface and the mobile phase move about or through the stationary phase carrying with it the sample of interest. In exercise the stationary gas chromatography and supercritical fluid chromatography the stationary phase is fixed in place in a column in liquid chromatography the stationary phase may be fixed in place either in a column or on a phase can be a solid, a liquid adsorbed on a solid or an organic species (eg. A c18 alkyl chain) bonded to a solid surface.1 @ IJTSRD | Unique Paper ID – IJTSRD26474 | Volume – 3 | Issue – 5 | July - August 2019 Page 804
International Journal of Trend in Scientific Research and Development (IJTSRD) @ www.ijtsrd.com eISSN: 2456-6470 1.2.Types of chromatography: ?Normal phase chromatography 6 ?Reverse-phase chromatography 7 High-performance liquid chromatography (HPLC) is basically a highly Developed form of column liquid chromatography. As in normal solvent is allowed to drip through a column under gravity, it is instead forced through under high pressures of up to 400 atmospheres. That makes it much it much faster. All chromatographic separations, also the HPLC works under the same basic principle which states that separation of a sample into its constituent parts because of the difference in the relative affinities for the different molecules for the mobile phase and the stationary phase used in the separation. The components of the HPLC are shown in fig 28 2.Experimental work 2.1.Reagent and Chemical: Drug sample was obtained from Cadila Healthcare Ahmedabad, HPLC grade Methanol, Triethylamine, Orthophosphoric acid, Potassium dihydrogen phosphate, Anhydrous disodium hydrogen phosphate was obtained from Merk. 2.2.Chromatographic Condition: The basic Chromatographic Condition that was strictly followed during the research was as follows. The column selected should be Phenomenex C18 with the size as (150mm×4.6mm), 5μm id. The mobile phase used should be of phosphate buffer with pH 3.5, in ratio with the methanol as 85:15. The detection wavelength was used for 224nm. The flow time was about 0.9ml per min. The temperature should be Ambient throughout the work. The size of the sample was about 10 μl and the time of the working should be 6 min only. 2.3.Preparation of Phosphate Buffer, 0.025 M Standard: Dissolved 3.40g of potassium dihydrogen phosphate and 3.55g of anhydrous disodium hydrogen phosphate, both previously completely dried at 110º to 130º for 2 hours, in water to produce about 1000 ml sol.9 2.4.Preparation of standard stock solution of ZMT: Accurately weighed 10mg of ZMT and transferred to100 ml volumetric flask containing few ml of mobile phase (buffer 85: Methanol 15 at pH 3.5). The volume was made up to the mark using mobile phase slowly and with mild shaking to make the resultant solution of 100μg/ml. This solution was ultrasonicated for 20 min in two cycles each of 10 min. Also, it was the filter through a 0.45μ membrane filter. 2.5.Preparation of working solution of ZMT 1.0ml of this solution was withdrawn and diluted to 10ml with mobile phase (buffer 85: Methanol 15 at pH 3.5) to make the resultant solution of 10μg/ml. This solution was ultrasonicated for 30 min in three cycles each of 10 min. Also, it was then filtered through a 0.45μ membrane syringe filter. This solution was then used for further analysis. 3.Result and Discussion 3.1.Material Characterization 3.1.1.Melting point: Here Melting point of Zolmitriptan (ZMT) was determined using digital melting point apparatus (Labatronics) by capillary method and found to be 137º C. The reference melting point of ZMT was 136 -141°C. Finally, the experimental melting point was found in conformity with standard melting point (136-141º C). 3.1.2.determination of absorption maxima: The absorption maximum of ZMT was determined in the mobile phase of phosphate buffer pH 3.5 and methanol in the ratio of 85:15. The 10μg/ml solution was selected for this experiment and the same was prepared as per the procedure used earlier. The UV spectrum obtained was as shown in Figure 3. the maximum absorbance was obtained at 224 nm. The same was used for the setting of UV detector in HPLC for detection of ZMT. It is shown in table 1. The study was performed by six repeated measurements of the 10μg/ml solution of ZMT in the given chromatographic conditions as given earlier. Each chromatogram obtained was recorded and integrated to determine peak area, retention time, tailing factor and number of theoretical plates. The representative chromatogram for the study was as shown in Figure 4. The peak area and retention time were further evaluated by applying statistical parameters like standard deviation and percent relative standard deviation. The results obtained were as depicted in Table 2. From the results obtained the %RSD obtained for peak area and retention time was found within acceptance criteria as per ICH guideline Q2R1. Therefore, it was concluded that the method passed for the test of system suitability testing. 3.2 Method validation: 3.2.1 Linearity and Range: Linearity is defined as the mathematical relationship which can be can be graphically represented as a straight line, between the two quantities that are directly proportional to each other. From stock solution aliquots of 1.0, 2.0, 3.0, 4.0, 5.0 and 6.0ml were pipetted out and diluted up to 10ml to obtain the resultant solutions of 10, 20, 30, 40, 50 and 60μg/ml respectively. Each of this solution was injected to the given chromatographic conditions and chromatograms were recorded. The mean peak area was determined by integration of chromatograms. The calibration curve was constructed between concentrations of standard solutions versus peak area. Results were recorded for the equation of the line, correlation coefficient and intercept. Y = mX + c Where, Y = Peak area; m = slope; X = measured concentration; c = intercept The linearity of the method was assessed by injecting standard solutions in the range of 10 to 60μg/ml in triplicate to the given chromatographic conditions and mean peak area was determined in each case. The resulting mean peak areas for six standard solutions obtained were as depicted in Table 3. It was then plotted against the concentration to obtain a calibration curve. The calibration curve obtained for ZMT was as shown in Figure5 below. From the calibration curve obtained an equation of line was determined and was found to be Y = 30753x – 30217 The correlation coefficient was determined and found to be 0.9987. As the value for correlation coefficient was very near to linearity, it was concluded that the developed method was found to linear for the standard solutions of ZMT in the range of 10-60μg/ml. @ IJTSRD | Unique Paper ID – IJTSRD26474 | Volume – 3 | Issue – 5 | July - August 2019 Page 805
International Journal of Trend in Scientific Research and Development (IJTSRD) @ www.ijtsrd.com eISSN: 2456-6470 3.2.2 Precision is the measure of how close the data values are to each other for a number of measurements under the same set of experimental conditions. The precision of an analytical method is usually expressed as the standard deviation or relative standard deviation (coefficient of variation) of a series of measurement. The precision of the method was established by defining three quality control standards across the given range of 10 to 60μg/ml. Precision was studied by two different means viz. by assessing repeatability and intermediate precision. Repeatability was assessed in triplicate in a day after an interval of three hrs each. However, intermediate precision was performed on three different days. From the calibration range, three QC standards were defined viz. 15, 35 and 55μg/ml as LQC, MQC and NQC respectively. The solutions for QC standards were prepared by diluting the main stock standard solution of 1.5, 3.5 and 5.5ml up to 10ml. These three solutions were injected to given chromatographic conditions in triplicate and the mean peak area was then determined. Results were recorded to calculate mean, SD, %RSD. The results obtained for a precision experiment were as shown in Table 4. As shown in Table 4 the mean peak area obtained in the precision experiment to establish repeatability and intermediate precision was further subjected to statistical analysis to determine standard deviation and percent relative standard deviation. The results obtained for %RSD were less than 2% i.e. within acceptable limits as pet ICH Q2R1 guidelines. Hence, it was concluded that the present method successfully passed for the test for precision as per ICH Q2R1 guideline. 3.2.3 Accuracy: The accuracy of the analytical method is the closeness of the test result obtained by the method to the true value. % Accuracy was determined from the observations of precision study using the following formula, shown in Eq.1 Limit for % accuracy is NMT 5% RSD. The results obtained for percent accuracy study were as illustrated in Table 5. The results obtained for percent accuracy were in the range of 81.76 to 97.99 % w/w. Out of the results obtained the percent accuracy was failed for the concentration of ZMT at 35μg/ml. However, the agreement of results showed percent RSD within acceptance criteria. 3.2.4 Robustness: The robustness of an analytical procedure is defined as the measure of its capacity to remain unaffected by any of the small, but it is deliberate variations in method parameters and provides an identification mark of its reliability after its normal usage. Robustness of the method was established by a certain variation in method parameters. In this method, the parameters like organic concentration of the mobile phase and flow rate were varied as per Table6. The 10μg/ml concentration was selected for this experiment and the same was kept constant during all variations made in the method parameters. The selected concentration was injected three times at each level of change and chromatogram recorded. From the chromatograms obtained mean peak area was determined. It was the used for calculation mean measured concentration at each level of change and finally for determination of percent assay. The results were evaluated Precision: for compliance with the pharmacopoeial standards and displayed in table 7, 8 The chromatograms were recorded for each deliberate variation in method parameter and corresponding peak area was determined. Hence it was concluded that the method was proved to be robust for deliberate variation in method parameters. 3.2.5 %Recovery: Percent recovery is the determination of percent purity of given drug analyte in the finished product. Percent recovery experiments were carried out using spike method (standard addition method) at three different levels (80%, 100% and 120%) Known amounts of standard solutions containing analyte were added to pre-quantified sample solutions to get 80, 100 and 120% levels. These samples were analyzed by injecting the sample solution for a given chromatographic condition in triplicates. 10mg of ZMT (API) was weighed accurately and transferred to 100ml volumetric flask containing some amount of mobile phase and volume was made up to the mark using mobile phase to obtain a concentration of 100μg/ml. The resulting solution was filtered through 0.45μ membrane filter and sonicated for three cycles each of 10 min. From the stock solution 1.0ml was withdrawn using micro-pipette in triplicate and kept in three different 10 ml volumetric flasks, cleaned previously and diluted up to 10ml by using mobile phase to obtain resultant solution of 10μg/ml. These solutions were injected for given chromatographic system in triplicate and mean peak area was determined and was and it was subtracted from the area of corresponding standard solution (10μg/ml) to attain actual peak area for sample solution The results obtained were in compliance with the compendial standards for Zolmitriptan as per USP. Therefore, eventually, it was concluded that the presented developed and validated method can be successfully used for the scheduled quantitative determination of ZMT in the capsule dosage form. Figure 6 indicates the Chromatogram of ZMT obtained for % recovery experiment, Eq.2 3.2.6 LOD and LOQ: The detection limit is a characteristic of the limit test. It is defined as the lowest amount of analyte in a sample that can be detected, but not quantitated, under the particular experimental conditions. The quantitation limit is one of the characteristic property of quantitative assays for compounds with the low level in sample matrices, such as impurities in bulk drug substances and degradation products in finished pharmaceuticals. Limit of detection (LOD) and Limit of quantitation (LOQ) were determined from the following formulae, Shown in Eq.3. The LOD and LOQ should be expressed in μg/ml for ZMT. The results acquired for LOD and LOQ were as illustrated in Table 10 From the results obtained, it can be stated that the amount of ZMT as low as 2.45 and 7.42 can be successfully detected and quantified respectively using the proposed method. Therefore, it was concluded that the method was sensitive enough for estimation of ZMT as drug substance. STEYX = STEYX as per MS excel = STEYX (known_y's,known_x's) Where STEYX = Standard error of Y and X-axis. @ IJTSRD | Unique Paper ID – IJTSRD26474 | Volume – 3 | Issue – 5 | July - August 2019 Page 806
International Journal of Trend in Scientific Research and Development (IJTSRD) @ www.ijtsrd.com eISSN: 2456-6470 4.Conclusion The present study was aimed to develop a sensitive, precise and accurate RP-HPLC method for the analysis of Zolmitriptan in bulk and pharmaceutical dosage forms. Different Mixtures of phosphate buffer (25mM, pH 3.5) and methanol combinations were tested as a mobile phase on a C18 stationary phase. A mixture of the buffer: Methanol (pH 3.5) in a proportion of 85:15v/v was proved to be the most suitable of all combinations since the chromatographic peaks were better defined and resolved and almost free from tailing. The retention time obtained for Zolmitriptan was 3.57min. System suitability parameters were studied with within the acceptance criteria as per ICH Q2R1 guideline. The peak areas of Zolmitriptan were reproducible as indicated by % RSD within the limit. A good linear relationship (r2=0.9987) was observed between the standard concentration of Zolmitriptan and the respective peak areas. The regression curve was constructed by linear regression fitting and its regression equation was y = 30753x – 30217 (Where Y gives peak area and X is the concentration of the Zolmitriptan). The presented method was validated for following parameters as per ICH guideline Q2R1 this validation Hence, it was concluded that the proposed RP- HPLC method was sensitive and reproducible for the analysis of Zolmitriptan in pharmaceutical dosage form (capsules) with short analysis time. Conflict of Interest: The authors declare that there are no conflicts of interest. 5.References: [1]B. Harborne, J. Preparative Techniques-Applications in Natural Product Isolation: By K. Hostettmann, M. Hostettmann and A. Marston. Springer, Berlin, 1986. 139 Pp. DM 98. Phytochemistry 1987, 26 (9), 2653–2653 DOI: 10.1016/s0031- Content of Tables 9422(00)83903-5. [2]Clark Still, W.; Kahn, M.; Mitra, A. Chromatographic Separations with Moderate Resolution Figure 2. Silica Gel Particle Size6 (#rm): (·) r/w; (O) r/(w/2); 1978; Vol. 43. Rapid Technique for Preparative [3]Martin, A. J. P.; Synge, R. L. M. A New Form of Chromatogram Employing Two Liquid Phases. 1. A Theory of Chromatography 2. Application to the Micro- Determination of the Higher Monoamino-Acids in Proteins. Trends Biochem. Sci.1977, 2 (11) DOI: 10.1016/0968-0004(77)90204-3. [4]Jungbauer, A.; Hahn, R. Chapter 22 Ion-Exchange Chromatography. In Methods in Enzymology; 2009; Vol. 463, pp 349–371. [5]Fujita-Yamaguchi, Y. Affinity Chromatography of Native and Recombinant Proteins from Receptors for Insulin and IGF-I to Recombinant Single-Chain Antibodies. Frontiers in Endocrinology. 2015. [6]Meyer, V. R. Practical High-Performance Liquid Chromatography 5th; 2010. [7]L.R.Snyder, J.L.Glajch, J. L. K. “Practical HPLC Method Development”, 2nd Edition. Chromatographia1998, 47 (3–4), 767 DOI: 10.1007/BF02466588. [8]David, B.; Matthew, J.; Marisa, A. Remington the science and practice of pharmacy, ed 21st Lippincott Williams and Wilkins Publishers: Philadelphia, 2005; pp. 495, 1505, 1711-1712 Chromatographic [9]Indian Pharmacopoeia 2007, Volume 1, Published by Ministry of Health, Government of India, New Delhi, pp. 248. Sr. No. Wavelength (nm) Absorbance 1. 284 2. 224 0.196 1.268 Table 1 Observation table for UV spectrum showing absorbance values at different wavelengths Sr. No. 1 2 3 4 Parameter Peak Area Retention time Number of Theoretical plates* Tailing factor* Table2 Results obtained for system suitability testing and their evaluation Mean observations 292112.7 3.57 2967 1.72 SD %RSD Acceptance criteria Inference 1.46 < 2 0.45 < 0.5 -- > 2000 -- < 2 4271.27 0.02 -- -- Pass Pass Pass Pass Sr. No. Conc. (μg/ml) Observed Peak Area Mean Peak Area* 294993 293992 295454 568762 579259 588539 873109 853027 899017 1216459 1186440 1220462 1 10 294813 2 20 578853 3 30 875051 4 40 1207787 @ IJTSRD | Unique Paper ID – IJTSRD26474 | Volume – 3 | Issue – 5 | July - August 2019 Page 807
International Journal of Trend in Scientific Research and Development (IJTSRD) @ www.ijtsrd.com eISSN: 2456-6470 1489299 1471187 1480114 1831095 1860281 1829191 5 50 1480200 6 60 1840189 Table3 Observation table for linearity Intra-day precision Mean area ± SD 425682.33 ± 3284.62 853934.33 ± 11764.98 1521272.33 ± 9587.04 Inter-day precision Mean area ± SD 421815.78 ± 8276.88 849840.00 ± 9753.51 1521755.78 ± 18334.41 Conc. (μg/ml) % RSD Inference 0.77 1.38 0.63 % RSD Inference 1.96 1.15 1.20 15 35 55 Pass Pass Pass Pass Pass Pass Table4 Observation table for Repeatability and Intermediate precision experiment Sr. No. Conc. (μg/ml) Observed Peak Area 417073.67 417000.67 431373 838810.33 853382.33 857327.3 1512052.67 1510312.00 1542903 Mean Peak Area* Mean Measured Conc. (μg/ml) % Inference (Std. for ZMT USP 90-110% w/w) Accuracy 1 15 421815.78 14.70 97.99 Passed 2 35 849840.00 28.62 81.76 Failed 3 55 1521755.78 50.47 91.76 Passed Table5 Observations for % Accuracy determination from the data obtained for precision experiment Method parameters Standard Variation 1 Variation 2 15 17 0.9 0.95 Organic concentration of mobile phase (± 2%) Flow Rate (± 0.05ml) Table6 Robustness experiment design 13 0.85 Methanol Concentration (%) Standard Conc. (μg/ml) Mean peak area* Mean measured conc. (μg/ml) Inference (Compendial standard 90-110 %w/w) Observed Peak Area % Assay 294993 293993 295454 296033 299311 297426 299492 317948 285332 15 10 294813 10.57 105.69 Passed 13 10 297590 10.66 106.59 Passed 17 10 300924 10.77 107.68 Passed Table7 Observations of robustness experiment for organic concentration variation Mean measured conc. (μg/ml) Inference (Compendial standard 90-110 %w/w) Flow Rate (ml/min) Standard Conc. (μg/ml) Observed Peak Area Mean peak area* % Assay 294993 293993 295454 298492 310814 288792 297624 321537 288738 0.9 10 294813 10.57 105.69 Passed 0.95 10 299366 10.72 107.17 Passed 0.85 10 302633 10.82 108.23 Passed Table7 Observations obtained for flow rate variation in the robustness experiment @ IJTSRD | Unique Paper ID – IJTSRD26474 | Volume – 3 | Issue – 5 | July - August 2019 Page 808
International Journal of Trend in Scientific Research and Development (IJTSRD) @ www.ijtsrd.com eISSN: 2456-6470 % Conc. of standard spiked (μg/ml) Conc. of the sample (μg/ml) Mean peak Area of sample conc.* Amount recovered (μg/ml) Inference (Standards 90-110%w/w) % Recovery Level Recovery 80 20 16 477154 16.50 103.70 Pass 100 20 20 631795 21.53 109.84 Pass 120 20 24 729010 24.69 105.62 Pass Table8 Observations obtained for percent recovery study of ZMT in capsule dosage form Standard Drug Solution LOD (μg/ml) LOQ (μg/ml) Zolmitriptan Table10 Calculation of LOD and LOQ for the present method 2.45 7.42 Figures Figure1 Zolmitriptan [(4S)-4-({3-[2-(dimethylamino)ethyl]-1H-indol-5-yl}methyl)-1,3-oxazolidin-2-on Figure2 Components of HPLC instrument Figure 3 UV spectrum of Zolmitriptan recorded in mobile phase phosphate buffer: methanol in the ratio of 85:15 at pH3 @ IJTSRD | Unique Paper ID – IJTSRD26474 | Volume – 3 | Issue – 5 | July - August 2019 Page 809
International Journal of Trend in Scientific Research and Development (IJTSRD) @ www.ijtsrd.com eISSN: 2456-6470 UV1000-224nm Name Retention Time 30 30 25 25 20 20 15 15 mAU 10 10 5 5 ZOLMITRIPTAN 3.58 0 0 -5 -5 0.0 0.2 0.4 0.6 0.8 1.0 1.2 1.4 1.6 1.8 2.0 2.2 2.4 2.6 2.8 3.0 3.2 3.4 3.6 3.8 4.0 4.2 4.4 4.6 4.8 5.0 5.2 5.4 5.6 5.8 Minutes Figure4 Chromatogram of ZMT obtained in Chromatographic conditions Figure5 Calibration curve obtained for Zolmitriptan showing linearity with a correlation coefficient of 0.9987 Figure6 Chromatogram of ZMT obtained for % recovery experiment Equations: Equation 1 Accuracy Equation 2 % Recovery A. B. Equation 3 A. LOD B. LOQ @ IJTSRD | Unique Paper ID – IJTSRD26474 | Volume – 3 | Issue – 5 | July - August 2019 Page 810