Download
1 / 5
50 likes | 114 Views
Ground water samples of Tanda taluka of Rampur district have been collected either from the<br>bore wells (from the part of municipal water supply) or from hand pumps (direct consumption)<br>one analyzed for their physico- chemical properties. The results indicates that fluoride<br>concentration is varies from 0.46-4.36 mg/L. Also in this Analysis the physico- chemical<br>parameters such as pH, electrical conductivity, TH, TA, Na <br>, Cl,<br>TDS, SO4<br>2-, F,<br>K <br>, calcium<br>and magnesium etc. were determine using standard procedures. Also in this paper due to<br>increase permissible limits of fluoride in Tanda taluka a survey for dental and skeleton fluorosis<br>is also done, which denotes mainly dental and Skelton fluorosis in the studied taluka. Thus an<br>attempt was made to improve the ground water quality of Tanda taluka of district Rampur, U.P.,<br>India. <br>

E N D
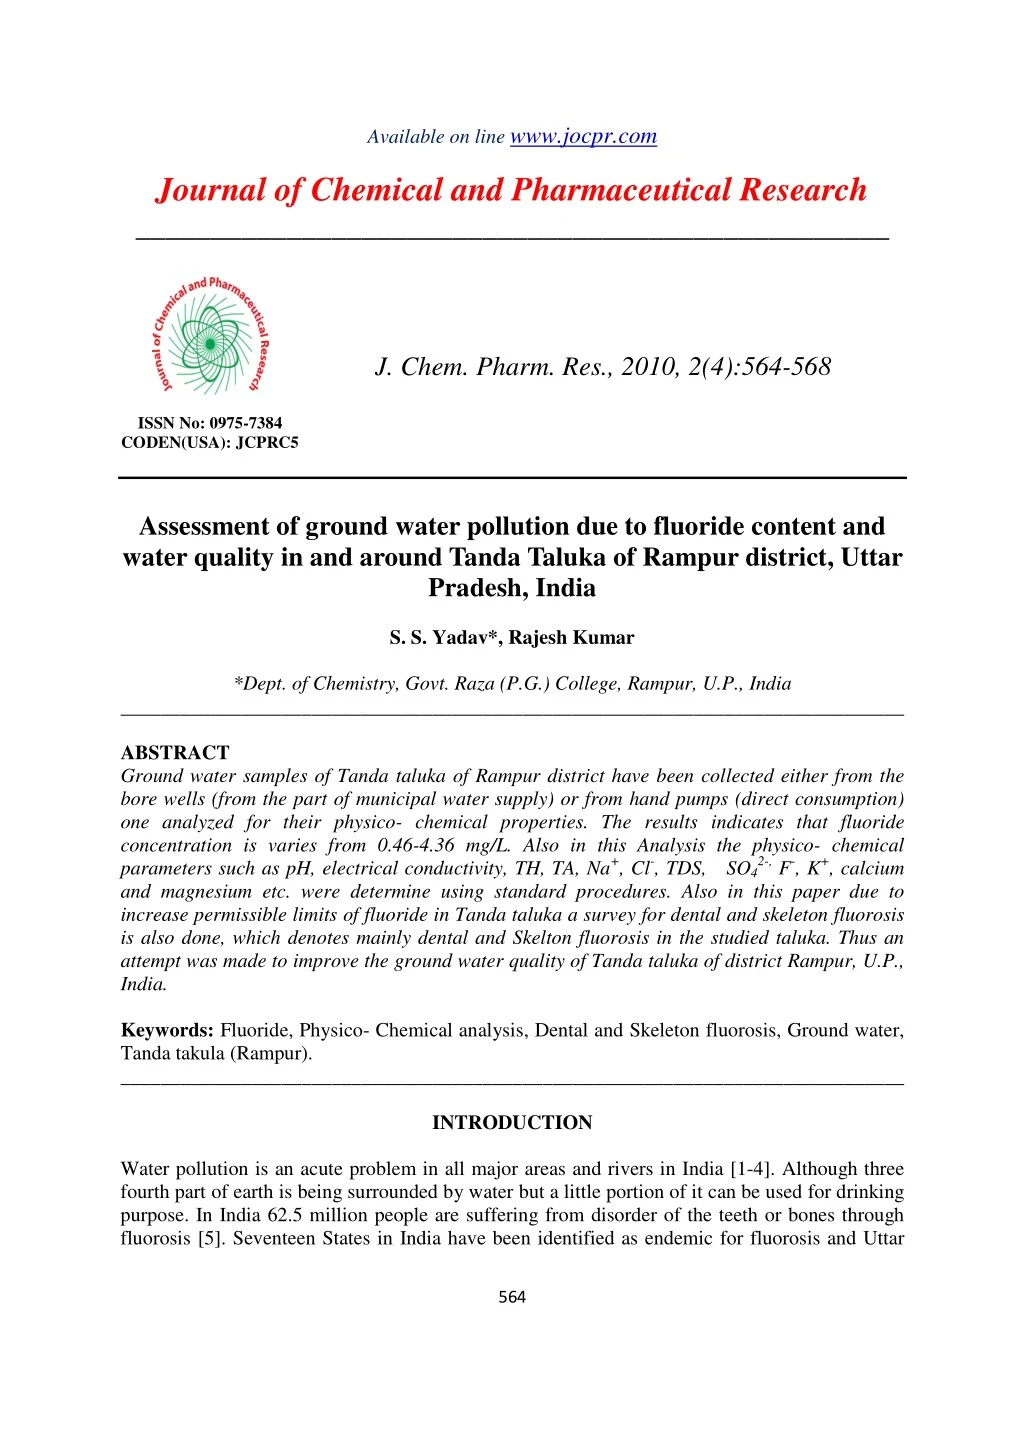
Available on line www.jocpr.com Journal of Chemical and Pharmaceutical Research __________________________________________________ J. Chem. Pharm. Res., 2010, 2(4):564-568 ISSN No: 0975-7384 CODEN(USA): JCPRC5 Assessment of ground water pollution due to fluoride content and water quality in and around Tanda Taluka of Rampur district, Uttar Pradesh, India S. S. Yadav*, Rajesh Kumar *Dept. of Chemistry, Govt. Raza (P.G.) College, Rampur, U.P., India ______________________________________________________________________________ ABSTRACT Ground water samples of Tanda taluka of Rampur district have been collected either from the bore wells (from the part of municipal water supply) or from hand pumps (direct consumption) one analyzed for their physico- chemical properties. The results indicates that fluoride concentration is varies from 0.46-4.36 mg/L. Also in this Analysis the physico- chemical parameters such as pH, electrical conductivity, TH, TA, Na+, Cl-, TDS, SO42-, F-, K+, calcium and magnesium etc. were determine using standard procedures. Also in this paper due to increase permissible limits of fluoride in Tanda taluka a survey for dental and skeleton fluorosis is also done, which denotes mainly dental and Skelton fluorosis in the studied taluka. Thus an attempt was made to improve the ground water quality of Tanda taluka of district Rampur, U.P., India. Keywords: Fluoride, Physico- Chemical analysis, Dental and Skeleton fluorosis, Ground water, Tanda takula (Rampur). ______________________________________________________________________________ INTRODUCTION Water pollution is an acute problem in all major areas and rivers in India [1-4]. Although three fourth part of earth is being surrounded by water but a little portion of it can be used for drinking purpose. In India 62.5 million people are suffering from disorder of the teeth or bones through fluorosis [5]. Seventeen States in India have been identified as endemic for fluorosis and Uttar 564
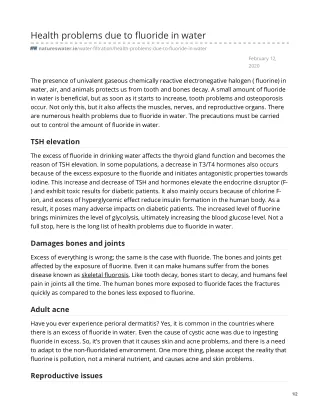
S. S. Yadav et al J. Chem. Pharm. Res., 2010, 2(4):564-568 _____________________________________________________________________________ Pradesh is one of them. The content of fluoride in Rampur is also more than WHO and ICMR permissible limits [6]. Fluorosis is an endemic disease resulting from excess intake of fluoride either through drinking water, food or dentifrices at concentration of 2.00 ppm or above. Fluorosis of teeth has been reported to affect dental enamel. Chronic fluorine intoxication through drinking water containing above 10 ppm of fluorine results in pathological changes of bone leading to skeleton fluorosis [7]. Also pollution of water resources needs a serious and immediate attention through periodical check up of water quality. The purpose of this study to evaluate ground water quality of Tanda taluka of Rampur district, Uttar Pradesh, India. EXPERIMENTAL SECTION STUDY AREA - The Tanda taluka of Rampur district is 30 km far away from Rampur. The district Rampur is located between longitude 78.54E and 69.28 E, latitude 28.25 N and 29.10N . Rampur district is spread in the area of 2367 KM2 falls in Moradabad division of Uttar Pradesh State with a population of approximately four million. (Figure 1and 2) Fig.1-Location of Uttar Pradesh in India Fig.2-Location of Rampur showing Tanda It is around Udham Singh Major in North, Bareilly in East, Moradabad in West and Badaun in South situated on the NH 24 and 185 km from national capital. In Tanda taluka rural population is living and 85% ground water is used for drinking purpose by the rural population. Water Sampling - A total of 100 samples from the twenty five villages of Tanda taluka of Rampur district were collected in polythene bottles (i.e., four samples from each village) which were cleaned with acid water, followed by rinsing twice with distilled water. The water samples are chemically analyzed. The analysis of water was done using procedure of standard methods. 565
S. S. Yadav et al J. Chem. Pharm. Res., 2010, 2(4):564-568 _____________________________________________________________________________ Methodology - Table 1 - Methods used for analysis of quality parameters for water samples [8] Quality parameters Methods used pH EC TDS Na+, K+, Cl- F- SO42- Cl- Ca2+/ Mg2+ Eutech- Cybernetics pH meter Eutech- Cybernetics EC Scan meter United State salinity lab. , 1954 [9] ELICO-220 Flame photometer Spectophotometrically using ELICO-52 UV Spectrophotometer Naphalometrically using ELICO-52 Naphalometer Argentometric Method EDTA Method/ Titrametric Method using H2SO4 RESULTS AND DISCUSSION Table 1 -Physico –chemical analysis of water quality in selected village’s samples of Tanda taluka S.No. pH EC TDS TH TA Ca2+ Mg2+ Na+ K+ HCo3- Co32- Cl- 1 7.5 2.10 540 834 834 40 2 7.2 3.33 1250 1016 1031 42 3 7.3 1.18 840 176 772 16 4 7.5 1.75 1006 160 1016 28 5 7.2 2.03 930 156 823 33 6 8.19 3.98 1210 89 786 63 7 7.23 3.69 828 916 552 58 8 8.05 5.02 796 412 907 18 9 7.84 4.06 648 428 956 21 10 7.79 1.02 540 610 782 13 11 8.06 1.25 516 586 730 44 12 7.15 3.89 410 926 632 56 13 7.44 7.45 2106 1024 796 61 14 7.30 2.95 1620 223 746 57 15 8.16 2.00 1516 328 702 32 16 7.12 1.64 848 416 601 36 17 7.05 2.02 546 169 520 48 18 8.29 2.18 1524 154 617 91 19 7.25 5.06 816 1110 628 85 20 7.76 1.20 1410 948 816 31 21 7.86 3.45 1521 1158 643 42 22 7.90 1.78 1658 1146 712 42 23 8.12 2.70 1214 946 546 87 24 8.15 1.10 1608 853 673 27 25 8.26 6.12 660 1210 935 93 So42- F- 156 04 18 22 18 27 32 18 24 46 28 21 26 68 61 32 52 56 24 16 31 47 52 19 21 18 140 0 170 8 512 4 602 6 440 4 310 6 388 3 292 3 104 6 408 4 309 16 777 321 1 212 3 288 3 310 2 412 9 506 7 119 6 528 4 203 3 383 3 168 7 499 6 506 3 393 4 156 393 256 902 768 520 515 942 885 906 56 93 57 137 81 68 57 82 137 102 56 81 82 37 62 41 58 87 92 106 54 42 79 83 98 31 170 188 172 102 203 806 349 165 413 70 458 610 306 280 142 480 210 260 28 17 52 99 108 354 41 281 408 145 112 296 86 99 188 437 272 187 386 358 401 481 196 111 1.5 2.02 2.60 4.36 0.75 1.03 2.28 1.00 1.24 3.86 2.95 0.58 0.88 1.17 4.02 0.77 0.46 1.48 3.92 2.31 3.02 2.48 0.99 1.75 2.48 80 240 252 810 607 803 815 614 213 377 403 516 623 794 301 437 147 618 91 186 566
S. S. Yadav et al J. Chem. Pharm. Res., 2010, 2(4):564-568 _____________________________________________________________________________ The finding of the present investigation are summarized in (Table 1) and also made comparison with WHO and India drinking water standards (Table 2). Table 2-Comparison of ground water quality at different locations under study with drinking water standard (Indian / WHO) Parameters Standards pH 6.5-9.2 EC 6.5-9.2 TDS 1500 TH 600 TA 600 Ca2+ 200 Mg2+ 200 Na2+ 200 K+ 200 CO32- 200 HCO3- 200 Cl- 1600 So42- 400 F- 1.5 Tanda taluka is hot and semi – arid, soil water and depth of ground water varies from 6-20, manually operated hand pumps can easily be installed in study taluka to pump out the ground water. The ground water has no colour, odour, turbidity. Taste of water was slightly brackish at most of the location. The pH value of all the samples shows in the range 7.2-8.29. Also there is large variation in EC was also found in present study. The calcium content in water, few locations found beyond the permissible limits. Alkalinity present in water is more than acceptable limits in maximum locations. Also sodium was higher. The main result indicates the fluoride content is also higher than permissible limit and resulting diseases faced by Tanda taluka people. It is evident from the analysis data, fluoride content is more. Fluoride content of 1mg/L in drinking water has no biological side effects (10). So in Tanda taluka drinking water consumed for a period of 5-10 years caused dental fluorosis. Health status of the people is varied in different villages because of severity of fluorosis. Table 3-The clinical symptoms of fluorotic patients from Tanda taluka Age in Years Examined skeleton fluorosis 8-16 100 28 17-25 200 78 25-50 400 173 In this study, due to lack of luster were the most symptoms of dental fluorosis experienced by Tanda taluka followed by browning of teeth. The various grade of discoloration of teeth ranging Indian WHO 6.5-9.2 6.59.2 500 500 500 75 150 200 200 200 200 500 500 1.5 No. of people No. of people with dental and Percentage (%) 28% 39% 43.25% 567
S. S. Yadav et al J. Chem. Pharm. Res., 2010, 2(4):564-568 _____________________________________________________________________________ from chalky white to yellow or brown with pitting. The difference being attributed by temperature and it leads severity of the disease (11). CONCLUSION Most of the water samples collected from Tanda taluka does not meet water quality standards and any other quality parameters. Hence it is not suitable for drinking purpose. Also the people of that area are facing dental and skeleton problems also, mainly from dental and Skelton fluorosis. A hand pump attached filter based on Nalgonda Technology or activated alumina adsorption might be the solution of this problem. REFERENCES [1]APHA, AWWA and WPCF, 1998. “Standard methods for Examination of water and waste water ’’ 20th Edition. [2]Adebowale K.O., F.O.Agunbiade AND B.I. Olu-Owalasti, Impacts of natural and anthropogenic multiple sources of pollution on the environmental conditions Ondo State costal water Nigeria. EJEAF, 2008, 7 (4): 2797-2811. [3]BahadurY. And Chandra R, Monitoring the quality of river Ramganga at Bareilly. Poll.Res.2006, 15(1): 31-33. [4]Bhargava, D.S., Nature and Ganga. Envtal Conser,1987, 14(4): 307-318. [5]Susheela A.K., Curr. Sci., 2002, 77(10): 1250-1256. [6]Yadav S.S., Kumar Rajesh, Contamination of fluoride content in ground water of Rampur City, Uttar Pradesh, India. J. Ultra chem., 2010, 6(2):181-186. [7]Preek R, the Indian J Nutr Diet, 1994, 31:121-125. [8]Yadav S.S., Kumar Rajesh, Assessment of physico-chemical status of ground water in four blocks (Shahabad, Milak, Swar, Bilaspur) in Rampur district, Uttar Pradesh, India, Rasayan J Chem.,2010, 3(3):234-241. [9]United State Salinity Laboratory Staff, US Department of Agriculture Hand book, 1954, Washington. [10]D.C.Leona N.C., Public Health Rep., 2004, 69:925. [11]Choubisa S.L., Sampura K., Choubisa P.K., Sharma O.P., Indian J Environ Health, 2006, 38: 286-292. 568