Download

1 / 12
0 likes | 13 Views
Discover how to conduct the Wilcoxon-Mann-Whitney test using SPSS. Get our SPSS Assignment Help service providing expert support for assignments & case studies.<br>

E N D
Statisticshelpdesk.com SPSS Assignment Help Exploring the Wilcoxon Mann-Whitney Test Helpful SPSS Tool you can utilize for Assignments
Introduction Wilcoxon-Mann-Whitney test as a non-parametric statistical technique plays a crucial role in comparing two independent groups of data in big data analysis. However, this technique has remained unutilized among students and new researchers. This ppt aims to explore its application using SPSS with a hands-on example using a real dataset. About Wilcoxon-Mann-Whitney Test The Mann-Whitney U test determines whether there is a statistically significant difference in the distributions of two independent samples. Unlike parametric tests, the Mann-Whitney U test does not rely on the assumption of normally distributed data. It makes it appropriate for ordinal or continuous data. Statisticshelpdesk.com
Vital Concepts Null Hypothesis (H0): Both populations are of similar distribution. Alternative Hypothesis (H1): The two distributions differ. Data Requirements: The data must be independent. Can be ordinal or continuous, but not normally distributed. Why Use the Mann-Whitney U Test? 1. Non-parametric Nature: This is suitable where the sample size is small, or where the data has non-normal distribution of data. 2. Robustness to Outliers: As compared to parametric tests, this test is less affected by outliers. 3. Ease of Interpretation: Using medians and ranks, outcomes can be described, therefore the concepts are easy for students to understand. Statisticshelpdesk.com
Statisticshelpdesk.com SPSS Assignment Help How to Conduct Mann-Whitney U Test In SPSS ? Statisticshelpdesk.com
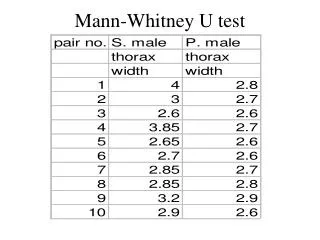
As an example that explains the Mann-Whitney U test in SPSS, we are going to use a hypothetical dataset of students' scores resulting from two different teaching methdologies. Dataset Description: : Assume that we have scores from two groups of students who have been taught with 2 different methodologies
Step-by-Step Guide to Running the Test Step 1: Preparing Your Data Step 2: How to performThe Mann-Whitney U Test You need to see that the data is in the right format in SPSS. This should be done in separate columns, in the same table, each with its own group (Method A and Method B). 1. Open your dataset in SPSS. 2. Select Analyze in the upper area of the screen. 3. Now go to Nonparametric Tests. 4. Select Independent Samples. Step 4: Running the Test Step 3: Setting Up the Test 1. Once the dialog box opens, drag both score variables (Method A and Method B) into the “Test Variable List” box. 2. In the “Grouping Variable” box describe your groups for example Method A = 1 and Method B = 2. 3. Go to Define Groups and set your group parameters. 4. Make sure that using "Mann-Whitney U” as the “Test Type” box is selected. Click OK to run the test. SPSS will process and produce output tables.
Interpreting SPSS Output 1 2 1. Ranks Table The ranks table displays the result in the form of mean ranks for each group 2. Test Statistics Table These include U statistic, the Z value, and the significance level or p, value. For our example dataset, let’s say the SPSS output shows: Mann-Whitney U = 5, Z = -1.23, Asymp. Sig (2-tailed) = 0.22 Conclusion from Results Here, therefore our p-value (0.22) is greater than our chosen alpha level (0.05) hence we fail to reject the null hypothesis. This also shows that there is no significant difference between the scores of students who use Method A and those who use Method B.
Some useful applications of the mann-whitney U test • Healthcare Education • Social Sciences Students’ performance analysis to differentiate between various teaching approaches. • The assessment of information acquired from surveys of different categories of people. • Comparing the results having different treatment strategies for the patients. Statisticshelpdesk.com
Overcoming Challenges with the Wilcoxon-Mann-Whitney Test: Several challenges arise for students when doing the Wilcoxon-Mann-Whitney test in the following ways; understanding and interpreting the assumptions of the test; misinterpreting SPSS output; and difficulties in selecting the correct data sets. It is easy to be lost and build up frustrations especially when trying to complete an assignment or even doing research within a tight deadline. There are various complexities attached to SPSS analyses, and this is where our SPSS Assignment Helpcomes in handy. Our specialists provide detailed explanation along with step-by-step solution for tasks involving Wilcoxon-Mann-Whitney test Therefore, students are capable of comprehending the overall purpose of the test. In providing individual support for completing assignments, case analysis, and analytical works we help students to improve their outcomes and strengthen their knowledge of statistics. Statisticshelpdesk.com
In addition to the Wilcoxon-Mann-Whitney test, we offer help with a variety of other statistical tests, including: • T-tests (independent and paired) • ANOVA (Analysis of Variance) • Chi-square tests • Regression analysis • Factor analysis Through real experiences and contemporary approach in presenting the information, our experts familiarize students with new perspectives on the Wilcoxon-Mann-Whitney test. Besides, it broadens their knowledge base and helps them to develop analytical thinking. Statisticshelpdesk.com
List of Helpful References Students looking to deepen their understanding of statistical analysis using SPSS may find these resources helpful: Field, A. (2018) Laerd Statistics 01 02 So this book allows discovering statistics using IBM SPSS Statistics. SAGE Publications. Mann-Whitney U Test. Available from Laerd Statistics Website. Pallant, J. (2020). 03 SPSS Survival Manual. Allen & Unwin. Statisticshelpdesk.com
Statisticshelpdesk.com SPSS Assignment Help www.statisticshelpdesk.com THANK YOU +44-1666260813 homework@statisticshelpdesk.com