Slides supporting chapter 6 of the book: Bhopal R S. Concepts of Epidemiology. Oxford, Oxford University Press, 2002,
Slides supporting chapter 6 of the book: Bhopal R S. Concepts of Epidemiology. Oxford, Oxford University Press, 2002, pp317 http://www.oup.co.uk/isbn/0-19-263155-1

Slides supporting chapter 6 of the book: Bhopal R S. Concepts of Epidemiology. Oxford, Oxford University Press, 2002,
E N D
Presentation Transcript
Slides supporting chapter 6 of the book: Bhopal R S. Concepts of Epidemiology. Oxford, Oxford University Press, 2002, pp317 http://www.oup.co.uk/isbn/0-19-263155-1
Natural history, spectrum, iceberg, population patterns and screening: interrelated concepts in the epidemiology of diseaseRaj Bhopal, Bruce and John Usher Professor of Public Health, Public Health Sciences Section, Division of Community Health Sciences,University of Edinburgh, Edinburgh EH89AGRaj.Bhopal@ed.ac.uk
Educational objectives On completion of your studies you should understand: • That the natural history of disease is the unchecked progression of disease in an individual. • Natural history ranks alongside causal understanding in importance for the prevention and control of disease. • The technical and ethical challenges posed in elucidating the natural history of disease are great. • That the changing pattern of disease in populations over time and the spectrum of the presentation of disease are related yet separate concepts.
Educational objectives • That the “iceberg of disease” is a metaphor emphasising that for virtually every health problem the number of cases of disease ascertained (those visible) is outweighed by those not discovered (those invisible). • How the iceberg of disease phenomenon thwarts assessment of the true burden of disease, the need for services and the selection of representative cases for epidemiological study. • Screening is the application of tests to diagnose disease (or its precursors) in an earlier phase of the natural history of disease (often in well people) than is achieved in routine medical practice. • The key to successful screening is a simple test which can be applied to large populations with minimum harm and has a high degree of accuracy. • The potential of screening is vast but there are important limitations.
Natural history of disease: class exercise • This is the uninterrupted progression in an individual of the disease from the moment of exposure to the causal agents. • Reflect on the four major possible outcomes in an individual of exposure to a causal agent.
Natural history: responses • First, the exposure may have no discernible effect. • Second, there may be demonstrable damaging effect of the exposure which may be repaired. • Third, the effect may be an illness that is rapidly contained by the body's defence mechanism. • Finally, the illness may progress until it leads to continuing long term problems, irreversible damage or death. • The outcome will depend on the interactions of host, agent and environmental factors.
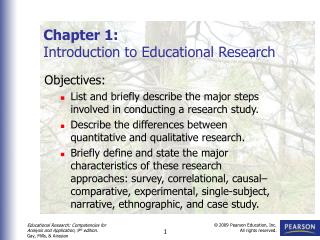
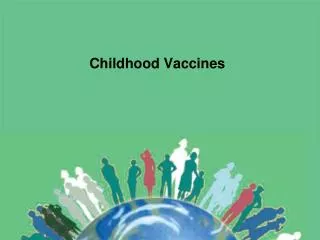
Natural history: graphic representation • Figure 6.1 provides an idealised view of the concept. • The same concept can be applied to individual diseases. • Tuberculosis provides an excellent example, which is illustrated in figure 6.2. • Figure 6.3 shows a typical path for the natural history of CHD.
Death Full health Time Infancy childhood adolescence adulthood old age Figure 6.1
Death 1b 2c 2b 2a 1a exposed Full health Time 1a: primary infection with complete remission (death from other causes); 1b: Fatal tuberculous meningitis; 2a: recurrence with successful treatment (death from other causes); 2b: TB with residual disability (and TB contributary or actual cause of death); 2c: recurrence with fatal outcome Infancy childhood adolescence adulthood old age Figure 6.5
Death Full health Time Infancy childhood adolescence adulthood old age Figure 6.3 Recurrence and death Disease and first manifestation can be diagnosed here, eg. MI Causes begin to exert their influence here
Obstacles to studying the natural history of disease • Information on natural history is very hard to obtain. • What difficulties can you see in studying the true natural history of disease? • Would you be willing to participate in a natural history study? • What might be the effect on you of being in such a study?
Natural history studies: consequences • First, the mere act of diagnosis and follow-up by a physician may initiate changes in the disease process. • Second, the scientific objective of observing the natural history of disease clashes with the ethical medical imperative to act to alleviate, contain or treat the disease. • Studies of the natural history of disease are potentially ethically explosive e.g the US Public Health Service’s Tuskegee syphilis study, where 600 "negro" men with syphilis in the state of Alabama in the USA were followed up for a period of about 40 years. • Follow up, or cohort, studies are needed to define the natural history of disease and such long-term observations may prove costly or impossible. • Natural history is, therefore, usually pieced together from a mixture of observations.
Natural history and incubation period • Time between exposure to the agent and the development of disease is called the incubation period. • Diseases that have long incubation periods generally have a long clinical course and, if so, by convention they are called chronic diseases. • Some chronic diseases, paradoxically, lead to sudden and unexpected death e.g. a stroke or heart attack. • The label chronic disease is based on the natural history as defined in many individuals.
Natural history and incubation period • Diseases with a short incubation period usually have a short course, and by convention are known as acute diseases. • These include most infections and many toxic disorders. • The effects of acute disease may also be severe and prolonged, eg post-viral syndromes. • The incubation period, together with minimal clinical information of the nature of the illness (e.g. a rash and fever), may be sufficient to identify the disease.
Natural history: applications • Natural history is vital for disease prevention policies. • It underlies secondary prevention based on screening • It provides a rationale for all health care. • Purpose of health care, including medicine, is to influence the natural history of disease by reducing and delaying ill-health. • When achieved through deliberate actions by societies the collective endeavour is public health.
Public health and medical action Death past future Present Full health Time Infancy childhood adolescence adulthood old age Figure 6.4
The population pattern of disease • Natural history of disease should not be (but is) confused with the changing pattern of disease in populations. • The distribution of a disease across socio-economic groups may change as it has for coronary heart disease. • I call this the “Population pattern of disease” • Main measures of PPOD are the disease incidence and prevalence.
Interrelationship between natural history and population pattern of disease: exercise • Assuming there are no changes to exposure to the causal agent, what effect would changing the natural history have on the population pattern? Consider, for example, the effect of : • Reduced and enhanced susceptibility • A shorter or longer course of disease • A longer and shorter incubation period • A more severe or less severe disease
Changing natural history and population pattern of disease • Reducing the population's susceptibility would diminish the number of cases of overt, diagnosed disease. • If the changes in susceptibility were uneven across a population, there will be other changes in the PPOD too, e.g. the reversal of inequalities in CHD. • A shorter course is also likely to have a better outcome, with less long-term morbidity so a lower prevalence, or lower mortality. • If the incubation period lengthens in a chronic disease from 20 to 30 years, then the disease burden will decline, at least in the short-term. • The idea that an exposure can lead to variants (and varying severity) of the same disease is the spectrum of disease.
Spectrum of disease • Disease may present with varying signs, symptoms and severity. • Tuberculosis is another particularly good example and as illustrated in table 6.1. • The spectrum of disease is, primarily, a population concept (while natural history is primarily a concept relating to individuals). • Diseases may be mild or even ‘silent’ -one of the many explanations for undiagnosed disease in the community. • This phenomenon is described by the metaphor of the iceberg of disease.
The unmeasured burden of disease: the metaphors of the iceberg and the pyramid • For most health problems there are large numbers of undiscovered or misdiagnosed cases of disease. • Serious and killing disorders such as diabetes, atrial fibrillation and hypertension are other good examples of this iceberg phenomenon. • Cases that have been correctly diagnosed can be likened to the tip of the iceberg, visible and easily measured.
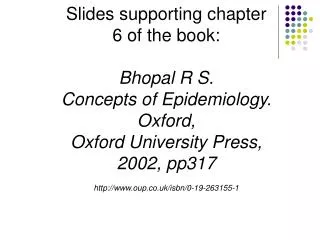
Iceberg/pyramid of disease • In most diseases, as with the iceberg, the larger presence lurks unseen, unmeasured and easily forgotten. • Figure 6.6 illustrates this idea and develops the iceberg concept in the form of a pyramid of disease by using its clear structure and shape. • Blocks 1 and 2 correspond to the iceberg above the sea-level and 3 to 5 below sea level. • Epidemiology that forgets the iceberg phenomenon of disease Is weak and potentially misleading.
1 Diseased, diagnosed & controlled 2 Diagnosed, uncontrolled 3 Undiagnosed or wrongly diagnosed disease 4 Risk factors for disease 5 Free of risk factors Diagnosed disease Undiagnosed or wrongly diagnosed disease Figure 6.6 The pyramid and iceberg of disease
Iceberg/pyramid of disease • Unidentified cases may be different to identified ones, both in terms of the natural history or spectrum of disease. • Where symptoms and disease progression and outcome are related, the undiagnosed cases are likely to be less severe. • When symptoms and signs are not evident in the early stages of disease, as in high blood pressure or chronic glaucoma, undiagnosed cases may be just as severe as diagnosed ones. • Epidemiological studies based on selected cases from the tip of the iceberg may give an erroneous view.
Iceberg/pyramid : severity of disease • Prostate cancer based on cases diagnosed in hospital would lead to the view that the disease is usually, if not always, progressive. • Unselected cases show that prostatic cancer can in some cases be a static, or slowly progressive, phenomenon. • Patients who are at the tip of the iceberg are more likely to have multiple health problems than others. • People with cardio-respiratory problems and diabetes are more likely to be admitted to hospital, than people with only one of these two problems. This is the basis of the bias known as Berkson's bias.
Screening • Screening is the use of tests to help diagnose diseases (or their precursor conditions) in an earlier phase of their natural history or at the less severe end of the spectrum than is achieved in routine clinical practice. • Screening attempts to uncover the iceberg of disease. • On the pyramid model in 6.7 screening is applied to block 3, and less commonly, to block 4. • Aim is to reverse, halt or slow the progression of disease. • Screening is also done to protect society. • Screening may be done to select out unhealthy people e.g. for a job. • Screening is sometimes done to help allocate health care resources. • Screening may be done simply for research, for example, to identify disease at an early stage to help understand the natural history.
1 Diseased, diagnosed & controlled 2 Diagnosed, uncontrolled 3 Undiagnosed or wrongly diagnosed disease 4 Risk factors for disease 5 Free of risk factors 1 Nil, except vigilance 2 Review 3 Opportunistic or population screening 4 Screening or health education 5 Protection of current status Figure 6.7
Screening: ethics and limitations • The ethical viewpoint, that the natural history of disease must be influenced favourably, sets limits on the scope of screening. • Screening could be done for every disease for which there is a diagnostic test or diagnostic signs and symptoms. • Criteria, usually variants of those of Wilson and Jungner. • These can be crystallised as six questions
Criteria for screening • Is there an effective intervention? • Does intervention earlier than usual improve outcome? • Is there an effective screening test that recognises disease earlier than usual? • Is the test available and acceptable to the target population? • Is the disease one that commands priority? • Do the benefits exceed the costs? • If the answer to these six questions is yes then the case for screening is sound
Screening: evaluating the case • Screening programmes need more careful evaluation than clinical care and we would make the case if Wilson and Jungner's criteria are met as for hypertension- • The benefits of screening for hypertension far exceed the costs. • The screening test is measurement of the blood pressure, usually using a sphygmomanometer. • The diagnostic test is, effectively, repetition of the same test on several occasions combined with a clinical history, examination and other tests to check for other diseases, particularly those that cause specific forms of hypertension. • Additional tests of high blood pressure are possible but used infrequently, including 24-hour readings using equipment that permits measurement while the person is ambulatory.
Screening: hypertension • The ideal test would pick up all cases of hypertension in the population tested. This attribute of the test is known as high sensitivity (or true positive rate). • The ideal test would also correctly identify all people who do not have the disease, that is, the test is specific to those who have the disease i.e. high specificity (or true negative rate). • When cases go for more detailed clinical examination, the screening test result is confirmed, so • A positive test predicts with accuracy the presence of hypertension, and similarly a negative test predicts its absence.
Screening tests: performance • These four measures, sensitivity, specificity and predictive power of a positive and negative test, are the main way to assess the performance of a screening test. • Measures of performance can be calculated from the 2 x 2 table as shown in table 6.3. • As the definitive test is never 100% accurate. • Screening test is being evaluated against another imperfect, albeit better, test.
Exercise: Calculating sensitivity and specificity, and predictive power • 500 patients known to have a particular disease were screened with a new test. • 500 controls without this disease were also screened. • Of the 500 patients 473 had a positive test. • Of the healthy group without the disease 7 had a positive test. • Create a 2 x 2 table based on table 6.3 and reflect on the interpretation of the data. • Calculate sensitivity and specificity of the test. • Is this a good performance? • What are the implications for those wrongly classified by the test?
Table 6.4 Calculation of sensitivity and specificity based on data in box 6.4
Sensitivity and specificity • The sensitivity (94.6%) and specificity (98.6%) of the test are very high. • The test will correctly identify most people who have the disease and correctly identify most people who are disease free. • About one person in twenty who does have the disease will be misclassified as disease free. • Far fewer people without disease will be misclassified as having the disease. • Individuals and their doctors who want to know the implications of their individual results and this is given by predictive power.
Predictive Powers • If a person is positive on the screening test and asks what is his chance of having the disease once all the tests are done, what can we advise? • Similarly, what do we advise if the test is negative on the screening test? • From table 6.4 calculate predictive powers.
predictive powers and prevalence • Predictive power of a positive test is a/a+b = 473/480 = 98.5%; • and of a negative test is d/c+d = 493/520 = 94.8%. • Only one or two percent of those testing positive will have this result overturned by the definitive test. • More of those with a negative test, however, will have this result overturned. • The prevalence of the disease has a profound effect on the predictive powers.
Predictive powers • Imagine that the prevalence of a disease is actually zero. • Then all screening test positive cases must, of necessity, be false positives. • If the prevalence of a condition is 100% then, logically, all screen positive cases will have the condition (and screen negatives will all be false), so the predictive power of a positive test is 100%. • Most diseases are uncommon, so the predictive power of a positive screening test tends to be low.
sensitivity and specificity: cut-off • The sensitivity and specificity are, however, profoundly affected by the "cut-off" value of the measure at which a test is defined as positive. • This is a very difficult decision. How do we make it? • For blood pressure, for example, we could take any cut-off value that is associated with a higher risk of disease. • This could mean a cut-off value less than 120/80 mmHg. • About half of the population would therefore be defined as hypertensive. • For most people so defined the true additional risk of disease would be very low. • At a cut-off of 180/120 few people would be defined as hypertensive and for those that were the target organ damage and incidence of disease would be high. • We would miss people who are at risk with, say, a blood pressure of 150/95 • There is a price to be paid for each choice of cut-off point.
Sensitivity and specificity: setting the cut-off value • The underlying reason for the reciprocal nature of the sensitivity and specificity is that, for most diseases, cases and non-cases belong to one, not separate distributions of values. • In figure 6.9(a) there are three distributions which could be described as low, medium and high blood pressure with varying levels of risk of hypertensive end-organ disease. • Figure 6.9(b) shows a more realistic, so-called bi-modal (two peak), distribution. • This type of distribution is not common but it illustrates the idea behind screening. • Figure 6.9c, however, is the picture portraying the distribution of the risk factors for many common disorders. • No natural separation between people at risk of disease and not at risk.
Group A a) % of population Group B Group C 70 70 70 80 80 80 90 90 90 100 100 100 110 110 110 120 120 120 130 130 130 140 140 140 150 150 150 160 160 160 170 170 170 180 180 180 190 190 190 200 200 200 Blood pressure [mmHg] b) Group D Group E % of population Blood pressure [mmHg] Group F c) % of population Blood pressure [mmHg] Figure 6.9
Sensitivity and specificity: setting the cut-off value • Cut-off point is set solely on a judgement balancing the importance of avoiding false positives (achieving high specificity) versus avoiding missing true positives (achieving high sensitivity). • Screening will make blocks 1 and 2 in the pyramid of disease (figure 6.7) grow and block 3 shrink. • Danger is that through false positive tests people in blocks 4 and 5 are wrongly placed in blocks 1 and 2, and through false negative tests people in blocks 1 and 2 are placed in blocks 4 and 5.
Setting cut-off points • Three actions are essential to help define the cut-off point. • Understanding of the natural history of the disease. • Weighing up the adverse consequences of treatment. • Judgments on the required sensitivity, specificity, and predictive powers of the screening test in the population to be screened.
Applications of the concepts of natural history, spectrum and screening • Health policy that has the objective to shift the natural history of disease to the right and alter the spectrum so disease is less severe. • Public health and medical action can be seen as the force spearheading the attack against ill-health and disease. • Knowledge of the natural history of disease can radically alter the organisation of health care so care is proactive. • Knowing the role of early life events in the genesis of heart disease and diabetes alters fundamentally our approach to these problems. • The need to influence the policies which foster good education and health of mothers and their infants is crystal clear. • The scientific rationale for health care agencies to seek partnership with other agencies such as education, housing and social services is overt • Cross-disciplinary working within health care (primary health care, paediatrics, obstetrics, nutrition and adult medicine) is seen as essential.
Applications of the concepts of natural history, spectrum and screening • Researchers studying people with disease now may need to obtain information about the life circumstances of the patient in childhood and even in-utero (the fetal origins hypothesis). • Epidemiological methods are needed that help people to recall information on causal factors. • New methods such as the life-grid approach where questioning is linked to memorable life events. • Prospective epidemiological studies require timescales measured in the same order of time as the natural history of the disease. • The timing of prevention interventions . • The iceberg of disease phenomenon requires that health policy should be based on a realistic estimate of the size of the unidentified population of cases and those at risk.
Epidemiological theory : symbiosis with clinical medicine and social sciences • Theory that many diseases are initiated by events acting years, or decades, before any clinical manifestation. • Diseases may manifest themselves in many ways, including asymptomatic yet damaging forms. • To understand why some people with symptoms and signs of disease seek care, and hence are diagnosed, while others do not, epidemiology crosses to the social sciences, linking into theories of illness seeking behaviour.
Summary • Natural history of disease is the uninterrupted progression of disease from its initiation by exposure to the causal agents to either spontaneous resolution, containment by the body’s repair mechanisms, or to a clinically detectable problem. • The primary purpose of public health and medicine is to influence favourably the natural history of disease. • Natural history of disease is related to (and influences) the changing pattern of disease in populations or the different levels of severity with which a disease may present (spectrum of disease). • For most health problems the number of cases identified is exceeded by those not discovered.
Summary • The iceberg phenomenon thwarts epidemiological efforts to assess the true burden of disease. • It is impossible to identify truly unselected and representative cases for epidemiological studies. • Screening is the application of tests to diagnose disease (or its precursors) in an earlier phase of the natural history of disease (often in well people) or in a less severe part of the disease spectrum than is achieved in routine medical practice. • These concepts are highly interrelated.