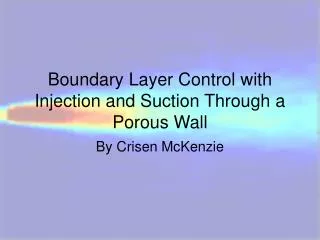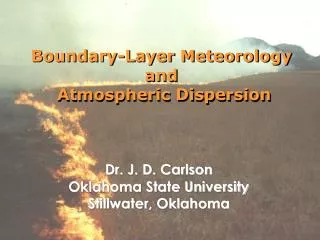
Boundary Layer Targeted Observations using the Glidersonde Meteorological Package Part I: Description and Results
Boundary Layer Targeted Observations using the Glidersonde Meteorological Package Part I: Description and Results. Daniel B. Weber Frank W. Gallagher III Kenneth Howard. Photo by Wayne Feltz. Dataplane History.

Boundary Layer Targeted Observations using the Glidersonde Meteorological Package Part I: Description and Results
E N D
Presentation Transcript
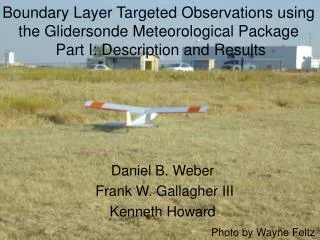
Boundary Layer Targeted Observations using the Glidersonde Meteorological Package Part I: Description and Results Daniel B. Weber Frank W. Gallagher III Kenneth Howard Photo by Wayne Feltz
Dataplane History • The Dataplane was launched as a collaboration between Drs. Frank Gallagher and Dan Weber in the spring of 2000. • The reusable platform consists of: • A radio controlled model aircraft • A computer controlled meteorological instrumentation package.
Dataplane Purpose • Test a newly developed instrument package via high-resolution targeted measurements of the boundary layer. • Scalars: temperature, pressure and water vapor.
Aircraft 40 Sized Trainer Senior Telemaster Photo by Wayne Feltz ©2000 Frank W. Gallagher III
Delivery Platform Specifications • Guidance: Radio controlled, pilot must see the aircraft • Wing span: 1.5-2.5m • Takeoff weight: 3.5-5kg • Range: 1-1.25km vertical and horizontal • Flight Duration: 20-25 minutes • Airspeed: 10m/s - 40 m/s • Source: Off the shelf kits and parts • Cost: Aircraft $350-$550
Instrumentation • Glidersonde project supported by Ken Howard and Mike Douglas at NSSL, CIMMS-OU. • Designed and built by Frank Gallagher, CIMMS-OU. • Tested Spring, Summer, Fall 2000.
Glidersonde Meteorological Package • Vaisala RS-80 Based Sensor • Pressure, Temperature, Relative Humidity • GPS Time, Position, and Aircraft Velocity • One-Second Data Acquisition • Data Stored on Board • Up to 5 Days with 20 Mb PCMCIA card • NiMH Batteries for 4-Hour Collection • Simple PC RS-232 Interface • Transmitter Option for Telemetry • Base Cost: $1500
Field Experiments • Winter wheat field, April 2000 • June 2000: Research Experiences for Undergraduates -- University of Oklahoma and Clark-Atlanta University • ARM Water Vapor IOP 2000, Lamont, OK
April, 2000 Wheat Field Study • Site: Northwest of Kingfisher, OK • Time: Evening soundings • Purpose: Capture the early development of the nocturnal boundary layer profile.
June, 2000 Field Study • Operations just south of the OU Norman, OK campus on the CORCS Club Field. • Operations commenced at 14:30Z and data were collected until 18:00Z. • Purpose: Capture the early development of a heated boundary layer during quiescent synoptic conditions.
REU Results • Numerous soundings taken Animated • Strong surface heating and superadiabatic surface layer observed. • Well-mixed boundary layer developed up to 900mb by the end of the observing period (noon). • Strong moisture gradient at the top of the mixed layer (6 C).
ARM Water Vapor IOP 2000 • Operations located at the ARM Central Facility. • Purpose: Supporting water vapor measurements for comparison with the on-site balloon launch, Dial and Raman Lidar data. • Operations window: 3pm to dusk, minimize background solar radiation/contamination for the lidars.
ARM Water Vapor IOP 2000 • Measurements obtained during four days: • Evening of September 29, 2000, off-site • Evening of September 30, 2000, off-site • Evening of October 2, 2000, on-site • Morning of October 3, 2000, on-site • Results from each period are compared to the dual balloon launches.
ARM Off-Site Observations • Obstacles: dirt roads, narrow runways, and numerous hazards ©2000 Frank W. Gallagher III
ARM WV IOP 2000, Off-Site Results ARM Dataplane
ARM On-Site Observations • Operations center located 100m northwest of the balloon trailer in groomed pasture. Balloon ©2000 Frank W. Gallagher III
Instrument Check Photo by Wayne Feltz
Summary • Dataplane vertical profiles of moisture and temperature compared favorably to the dual balloon sounding data. • Limited but useful tool for observing the boundary layer. • Some biases in temperature exist due to sensor location and will be addressed with the next version.