Mastering Exploratory Data Analysis (EDA)
Mastering Exploratory Data Analysis (EDA) is vital for any data professional. By understanding and applying the techniques outlined here, you can effectively explore datasets and uncover valuable insights.

Mastering Exploratory Data Analysis (EDA)
E N D
Presentation Transcript
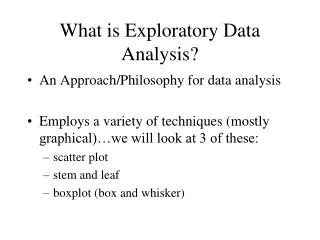
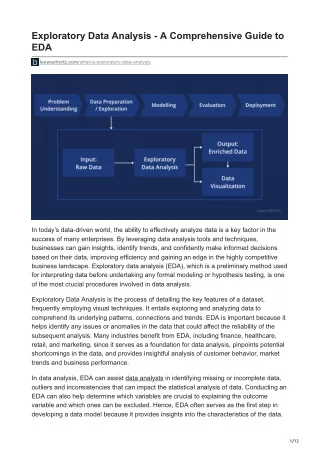
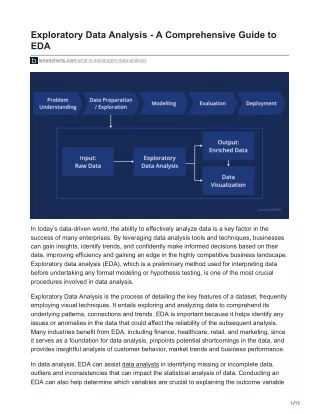
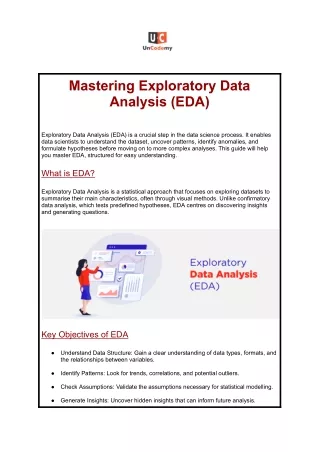
Mastering Exploratory Data Analysis (EDA) Exploratory Data Analysis (EDA) is a crucial step in the data science process. It enables data scientists to understand the dataset, uncover patterns, identify anomalies, and formulate hypotheses before moving on to more complex analyses. This guide will help you master EDA, structured for easy understanding. What is EDA? Exploratory Data Analysis is a statistical approach that focuses on exploring datasets to summarise their main characteristics, often through visual methods. Unlike confirmatory data analysis, which tests predefined hypotheses, EDA centres on discovering insights and generating questions. Key Objectives of EDA ● Understand Data Structure: Gain a clear understanding of data types, formats, and the relationships between variables. ● Identify Patterns: Look for trends, correlations, and potential outliers. ● Check Assumptions: Validate the assumptions necessary for statistical modelling. ● Generate Insights: Uncover hidden insights that can inform future analysis.
Steps in EDA 1. Data Collection Start by gathering data from various sources, such as databases, CSV files, or web scraping. Ensure that the data is relevant to your research question. 2. Data Cleaning a. Handling Missing Values Identify Missing Data: Use methods like heatmaps or summary statistics to visualise patterns of missingness. Impute or Remove: Decide whether to fill in missing values (using the mean, median, or mode) or drop records. b. Removing Duplicates Check for and eliminate duplicate rows to maintain data integrity. c. Correcting Data Types Ensure that data types (integer, float, string) are appropriate for analysis and convert them as necessary. 3. Descriptive Statistics Use descriptive statistics to summarise your data: ● Central Tendency: Mean, median, and mode provide insights into averages. ● Dispersion: Standard deviation and variance help you understand variability. ● Distribution: Skewness and kurtosis indicate the shape of the data distribution. 4. Data Visualization Visualisations make patterns easier to spot. Key techniques include: a. Univariate Analysis Histograms: Show the distribution of a single variable. Box Plots: Visualise the spread and identify outliers.
b. Bivariate Analysis Scatter Plots: Reveal relationships between two numerical variables. Bar Charts: Compare categorical variables against one another. c. Multivariate Analysis Heatmaps: Illustrate correlations among multiple variables. Pair Plots: Provide a matrix of scatter plots for pairwise relationships. 5. Identifying Relationships and Patterns a. Correlation Analysis Calculate correlation coefficients (Pearson, Spearman) to assess relationships. Visualise these relationships using heatmaps to highlight strong correlations. b. Grouping and Aggregation Use techniques like pivot tables or group-by functions to summarise data based on categories. Common Pitfalls in EDA ● Neglecting Data Quality: Failing to clean data thoroughly can lead to incorrect conclusions. ● Overlooking Outliers: Outliers can skew analysis; assess whether to include or exclude them based on context. ● Relying Solely on Visualisations: While powerful, visualisations should complement numerical analyses rather than replace them. Conclusion Mastering Exploratory Data Analysis (EDA) is vital for any data professional. By understanding and applying the techniques outlined here, you can effectively explore datasets and uncover valuable insights. Many professionals in Delhi have found that engaging in data analytics training in Delhi enhances their EDA skills, which can greatly improve their decision-making in data-driven projects. Embrace the process, stay curious, and let the data guide your exploration. As you embark on this journey, remember that continuous learning, whether through structured programs or self-study, is key to mastering EDA.