Download
1 / 59
590 likes | 879 Views
64% - Leisure travel a good way to take mind off stressful times ... WAR, 1990-91 ON AIR TRAVEL. 1990. 1991. Source: Air Transport Association % Change in ...

E N D
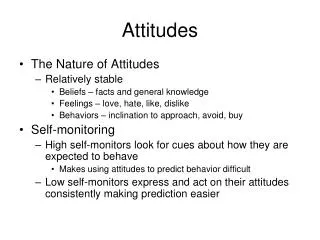
Slide 2:UNDERLYING TRAVEL ATTITUDES UNSHAKEN
83% - Important to be able to travel whenever and wherever I want 80% - Important to visit out-of-town family and friends 67% - Important Americans travel as they did before attacks Source: Travel Industry Association of America
Slide 3:UNDERLYING TRAVEL ATTITUDES UNSHAKEN
64% - Leisure travel a good way to take mind off stressful times 62% - Inconveniences of travel won�t stop me from traveling 61% - Leisure travel important to my well-being Source: Travel Industry Association of America
Slide 4:UNDERLYING TRAVEL ATTITUDES UNSHAKEN
60% - Travel in U.S. is safe 22% - Travel to destinations outside the U.S. is safe 83% - Travel and tourism is important to the health of the U.S. economy Source: Travel Industry Association of America
Slide 5:IMMEDIATE IMPACTS TIA CONSUMER SURVEY
78 million American adults had leisure travel plans for next 3 months prior to 9/11 Source: Travel Industry Association of America
Slide 6:MOST LEISURE TRAVEL PLANNERS ARE NOT CHANGING PLANS
53. 8 million 9.4 million 6.3 million 8.5 million Source: Travel Industry Association of America Among 78 Million Planners
Slide 7:IMMEDIATE IMPACTS AIRLINES
End of first week � Load factors less than 30% Now at 80% flight capacity, 85% seat-mile capacity, 45 - 55% load factors September traffic down 40 -50% 9/11-30 Losses $5 billion; 92,000 layoffs $15 billion government stabilization package Source: Air Transport Association
Slide 8:IMMEDIATE IMPACTS LODGING INDUSTRY
First week - nationwide occupancies averaged 52.3% - down 26% ADR that week was down 15% By 9/22 occupancy was 63.5%, still down 19% Big convention hotels, upper upscale, urban properties suffered most Source: Smith Travel Research
Slide 9:AMTRAK SEES INCREASING RIDERSHIP
During Crisis week - Average daily ridership up 17% Most long distance trains were sold out � ridership up 35% Currently � Systemwide ridership is up 12 - 15% Adding capacity and seeking $3 billion from government Source: Amtrak
Slide 10:SURGE FOR GREYHOUND
Surge in ridership during crisis week Now business as usual although long-distance (1,000 miles+) remains strong Certain leisure segments, such as casinos, negatively affected Traffic crossing borders is down
Slide 11:NEW YORK CITY IMPACTS
Hotel Occupancies fell to a low of 37% on 9/16; now in 45 � 50% range � versus nearly 90% last September Restaurants lost an estimated $20 million/day Broadway tickets sales off 80% during first week; now down about 50% Cancellations of major conventions limited 9/11 � 22 estimated NYC visitor spending loss of $163.7 million Image of NYC significantly enhanced Source: NYC & COMPANY
Slide 12:WASHINGTON, D.C. IMPACTS
Occupancies fell to from 10% to 65% depending on location (compared to normal of 72%) Occupancies now hovering in 35 � 45% range 12,000 job losses in hotel sector alone Smithsonian � as much as 75% down in visitation Reagan National Airport will re-open on Thursday Source: Washington D.C. Convention and Tourism Corporation
Slide 13: HAWAII IMPACTS
9/13 � 20: Domestic passengers down 31% Bookings from U.S. West stronger than U.S. East 9/13 � 26: Japanese visitors down 64% Approximately 70% of cancellations are rebooking for 4Q �01 or 1Q �02 Potential visitor day decline of 20%+ and $1 billion loss for September � December period Source: Hawaii Visitors & Convention Bureau
Slide 14:LAS VEGAS IMPACT
Weekend after 9/11 � occupancy was 67%, last weekend was 84% (Normal is 90%) Mid-week, occupancy still in the 60s, 20 points below normal 240 meeting/convention cancellations ADR down as much as 50% International markets off the most 10,000 layoffs in restaurant sector Shifting advertising to domestic � all in Southern California and within 2 hour flight Source: Las Vegas Convention & Visitors Authority
Slide 15:CORPORATE TRAVEL
Already weak and has taken an additional hit Business Travel Coalition Survey � 88% of corporate travel managers report employees will cut back travel in coming weeks 56% said their confidence in the security of U.S. aviation system had eroded very significantly National Business Travel Association � 58% of companies expect to reduce travel Sources: Business Travel Coalition, National Business Travel Association
Slide 16:CVB UPDATE
From 9/11 � end of October: �Corporate meetings essentially dried up� 25% of meetings scheduled for 9/11-31 have been cancelled, mostly by associations Of meetings planned for 2002, only 2% cancelled; but lower attendance expected Drive business less affected Destinations not all the same in terms of impact � urban destinations hurt most CVBs will face pressure on their budgets Source: International Association of Convention and Visitor Bureaus
Slide 17:OTHER TRENDS
RV rentals surged after attacks � stranded travelers rented RV to get home; RV business holding up better � strong turnout reported at RV shows; Regional parks outperforming destination parks Sources: Recreation Vehicle Industry Association, Silver Dollar City
Slide 18:TRAVEL VOLUME SINCE 9/11 AMONG TIA MEMBERS
Source: Travel Industry Association of America
Slide 19:LOSSES GREATEST AMONG
Larger Companies (100+ employees) Urban areas Northeast and South regions Businesses catering primarily to international visitors Airlines, tour operators and travel agencies Source: Travel Industry Association of America
Slide 20:LOSSES LEAST AMONG
Mid-Size Companies (50 � 99 employees) Rural areas West region Businesses serving primarily domestic markets Source: Travel Industry Association of America
Slide 21:PERCENT OF BOOKINGS CANCELLED SINCE 9/11 AMONG TIA MEMBERS
Source: Travel Industry Association of America
Slide 22:CHANGE IN NEW BOOKINGS SINCE 9/11 AMONG TIA MEMBERS
Source: Travel Industry Association of America Among Companies with bookings
Slide 23:TIA MEMBER EXPECTATIONS FOR REST OF 2001
Source: Travel Industry Association of America
Slide 24:TIA MEMBER EXPECTATIONS FOR 2002
Source: Travel Industry Association of America
Slide 25:PROSPECTS GOING FORWARD
Slide 26:AIR PROSPECTS
Revenue Passenger Miles: 4Q �01 -39%; FY 2001: -11.8% 1Q �02 -23% 2Q �02 -13% 3Q �02 Back to 2001 levels FY 2002 +4.8% Unprecedented losses of up to $24 billion since 9/11/01; Bankrupted Carriers Expect discounting Source: Air Transport Association
Slide 27:AUTO TRAVEL PROSPECTS
Could recover more quickly and increase due to: Shifts from air Stable gas prices Shift to closer-to-home travel Increasing interest in family travel Source: AAA
Slide 28:HOTEL INDUSTRY PROSPECTS
Sept. & Oct. 2001: Room demand -10 to - 12% ADR -2% 4Q �01 Room demand -6% 2001 Room demand -2.4% RevPar -4.7% ADR 0.5% Still profitable: $16.7 billion in 2001 Source: Smith Travel Research
Slide 29:HOTEL INDUSTRY PROSPECTS
1Q �02 Room demand -4% RevPar -6% FY 2002 Room Demand +1.2% RevPar -0.5% ADR No change Could take another 9 months to fully recover Source: Smith Travel Research
Slide 30:TRAVEL AGENT REVENUE PROJECTIONS 2000 - 2002
Source: American Society of Travel Agents Billions of Dollars
Slide 31:TOUR OPERATOR OUTLOOK
90% of tour operators have had cancellations; but only 2% report cancellations for 2002 International inbound tours most severely affected Northeast, NY and D.C. hit hardest Renewed interest in motorcoach tours History and cultural tours show relative strength Source: National Tour Association
Slide 32:INTENTIONS TO TAKE LEISURE TRIPS - NEXT SIX MONTHS
58% plan leisure trip in next six months Reasons for Not Taking Leisure Trips: Don�t have the money 21% Worried about job/future income 3% Don�t have the time 16% Health reasons/unable to travel 13% High travel prices 10% Travel not safe now 7% Airline/airport safely/security 6% Travel inconvenient now 4% Source: Travel Industry Association of America
Slide 33:COMPLEX SET OF FACTORS COULD AFFECT OUR PROSPECTS
Economy Consumer Confidence Consumer Confidence in Safety and Security of Travel Other Consumer Attitudes Shifting Travel Preferences Further Attacks Military Actions
Slide 34:U.S. ECONOMIC DEVELOPMENTS
Economy was already slowing prior to 9/11 Unemployment rising � up to 4.9% in August Business confidence has tumbled Consumer spending slowing 9 interest rates cuts by Fed this year Government spending
Slide 35:RECESSION ALMOST CERTAIN FOR 3Q AND 4Q 2001, FOLLOWED BY RECOVERY
% Change in Real GDP Source: DRI-WEFA
Slide 36:DRI-WEFA ECONOMIC FORECAST 2001-2002
Percent change from previous year 1Q 2Q 3Q 4Q 1Q 2Q �01 �01 �01 �01 �02 �02 Disp. Income 2.9 2.7 5.4 4.2 -0.1 1.7 Unemp. Rate 4.2 4.5 4.9 5.4 5.8 6.0 CPI 3.4 3.4 2.8 2.7 2.3 2.1 Source: DRI-WEFA
Slide 37:DRI-WEFA ECONOMIC FORECAST 2001-2002
Percent change from previous year �00 �01 �02 �03 Real GDP 4.1% 1.1% 1.6% 4.0% Disp. Income 2.6 3.5 2.6 4.1 Unemp. Rate 4.0 4.8 5.9 5.5 CPI 3.4 3.1 2.3 2.4 Source: DRI-WEFA
DROP IN CONFIDENCE ALREADY IN PROGRESS BEFORE 9/11 Source: The Conference Board, 1985=100Slide 39:CONSUMER CONFIDENCE 1990 - 2000
Source: The Conference Board, 1985=100
Note: Survey conducted prior to 9/11/01 Source: Travel Industry Association of America OVERALL TRAVELER SENTIMENT INDEX (U.S. Average, 2000 = 100) Source: Travel Industry Association of America FINANCIAL INDEX (U.S. Average, 2000 = 100 for Ability to Take Pleasure Trip Based on Personal Finances) Note: Survey conducted prior to 9/11/01Slide 42:EFFECTS OF RECESSION AND WAR, 1990-91 ON AIR TRAVEL
1990 1991 Source: Air Transport Association % Change in Revenue Passenger Miles over Prior Year
Slide 43:EFFECTS OF RECESSION AND WAR, 1990-91 ON LODGING
Source: Smith Travel Research 1990 1991 % Change in Room-Nights over Prior Year
Slide 44:THE �RALLY EFFECT�
90% Approval rating for President Bush (CNN/USA Today/Gallup) 89% approve of military action (CNN/USA Today/Gallup) 87% think America will recover and move on (CNN/Time) 79% think attacks will change country for the better � stronger and more united (Newsweek)
Slide 45:THE �RALLY EFFECT�
65% extremely/very confident American way of life will be preserved (CNN/USA Today/Gallup) 60% very confident U.S. economy will be prosperous in the long-term (CNN/USA Today/Gallup) 59% are optimistic about nation�s future; 70% optimistic about own future (Roper Reports) 43% say in good position to spend money, up from 35% in April (Gallup)
Slide 46:BUT CONFLICTING CONCERNS
77% following news very closely (Gallup) 66% believe attacks represent major change in terms of our sense of freedom/security (NBC/Wall Street Journal Poll) 63% attacks have shaken their sense of security (Los Angeles Times Poll) 49% very/somewhat worried about attack affecting their family (Gallup)
Slide 47:BUT CONFLICTING CONCERNS
66% think further attacks at least somewhat likely over next several weeks (CNN/USA Today/Gallup Poll) 66% worried about traveling by air because of risk of terrorism (CNN/Time Poll) 43% less willing to fly (CNN/Time Poll) 88% support new security procedures (CNN/USA Today/Gallup)
Slide 48:PROSPECTS FOR TOTAL U.S. DOMESTIC TRAVEL
3Q �01 - 5% 4Q �01 -10% FY 2001 - 5% 2002 + 1% Still below 2000 Levels Source: Travel Industry Association of America
Slide 49:POSSIBLE EFFECTS ON TRAVEL
Residential, closer-in, drive markets likely to do better Domestic better than outbound More interest in VFR Shift in activity preferences � increased popularity of Americana, heritage, more �serious� endeavors
TOP 10 ACTIVITIES AMONG DOMESTIC TRAVELERS, 2000 1. Shopping 33% 2. Outdoor Recreation 17 3. Historical Places/Museums 14 4. Cultural Events 10 5. Beaches 10 6. National/State Parks 10 7. Theme/Amusement Parks 9 8. Gambling 8 9. Nightlife/Dancing 7 10. Sports Events 6 Sources: Travel Industry Association of AmericaSlide 51:PARTICATION IN CULTURAL/ARTS/HERITAGE ACTIVITIES
% of 143.3 million travelers Sources: Americans for the Arts, Travel Industry Association of America
Slide 52:TRAVELER INTENTIONS
More Less Same Visit Family/Friends 35% 8% 57% Weekend Getaway 24% 20% 56% Small Town/Rural 23% 18% 59% Week+ Vacation 21% 26% 53% City/Urban Area 10% 35% 55% Source: Travel Industry Association of America
Slide 53:REACHING TODAY�S TRAVELER
Slide 54:MEDIA USED IN PAST YEAR TO PLAN TRIP/VACATION, 2001
Source: Travel Industry Association of America % of 135 Million U.S. Travelers
Slide 55:MEDIA JUDGED TO BE MOST USEFUL, 2001
Source: Travel Industry Association of America % of 82.0 Million U.S.Travelers who use Media
Slide 56:MEDIA JUDGED TO BE BELIEVABLE, 2001
Source: Travel Industry Association of America % of 82.0 Million U.S.Travelers who use Media
TRAVELERS� USE OF THE INTERNET 2001 EDITIONSlide 58:95 MILLION ONLINE TRAVELERS BUT GROWTH SLOWING
Source: Travel Industry Association of America Millions of U.S. online travelers
Slide 59:ONLINE TRAVEL PLANNERS UP 9% TO 65 MILLION IN 2001
Source: Travel Industry Association of America Millions of Online U.S. Travel Planners
Slide 60:31 MILLION ONLINE TRAVELER BOOKERS AND GROWTH CONTINUES
Source: Travel Industry Association of America Millions of U.S. Online Travel Bookers
Slide 61:CORE CONSUMER VALUES
Shifts in consumer values already underway but may be accelerated: Family Community Integrity Balance Authenticity Security Source: Yankelovich
Slide 62:WHAT TO DO NOW
People don�t buy things, they buy solutions to problems Make sure product orientation reflects core consumer values Redirect marketing � first contribute to greater good by giving more than receiving Business leaders need to bolster confidence Source: Yankelovich