Download
1 / 51
0 likes | 33 Views
Small molecule ligands (e.g., hormones, drugs) bind with bio-macromolecule targets (e.g., enzymes, receptors) in specific ways to exert their actions. Molecular docking tries to computationally simulate such bindings, aiming for predictions. Docking greatly helps in designing new drugs!<br>This presentation, in around 50 slides, aims to introduce chemistry students and researchers to detailed know-how about performing ligand-target docking using freeware packages AutoDock 4 and AutoDock Vina (aided by freeware packages UCSF Chimera and AutoDockTools) and about visualisation of the results.

E N D
Molecular (Ligand-Target) Docking using the freeware packages AutoDock 4 and AutoDockVinaJuly, 2024 Dr. Rituraj Kalita Department of Chemistry Cotton University, Guwahati sites.google.com/view/chemistry-rk
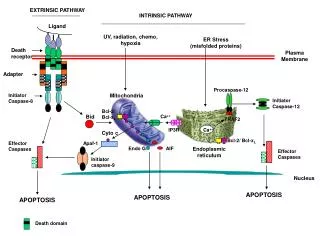
Molecular Docking – An Introduction • Small molecule ligands (e.g., hormones, drugs) bind with bio-macromolecule targets (enzymes, receptors) in specific ways to exert their actions. • Molecular docking tries to computationally simulate such bindings, aiming for predictions! • Docking greatly helps in designing new drugs! • For docking, MM computations are used (being faster) along with due aq. media solvent modelling. • Ligand-target binding is expressed in terms of some scoring function, e.g., EFEB in AutoDock 4.
Steps towards Ligand-Target Docking • Get expt. model of target having similar ligand. • Locate where that ligand is bound in the target. • Get ligand models – draw/collect, then optimize. • Pre-process downloaded macromolecule model – remove ligands, randomly bound water, add any missing residues, add the missing H-atoms. • Process ligand models – add charges, define atom types and rotatable bonds (save as pdbqt). • Process target model & grid box – add charges, define atom types, define g-box centre and size.
Docking Process & Output Visualisation • Both AutoDock and AD Vina use pre-defined force-field, solvation, etc. options (so no worry!) • Though in AutoDock, need choose a few options for grid map, docking search, output type, etc, aided by ADT (AutoDockTools). Then, aided by ADT, need first run AutoGrid, then AutoDock. • AD Vina needs be run just from Command Prompt. • Prelim. visualisation of output possible with ADT. • Detailed visualisation and analysis possible with Discovery Studio Visualizer, aided by PyMOL.
The Prelim. Steps: first with Chimera • Here we choose to dock PPI drugs SCH28080 and pantoprazole, with proton pump ATPase enzyme. • From RCSB PDB, downloaded expt. structure 5YLV.pdb having SCH28080 bound to the ATPase. • Opened 5YLV.pdbin UCSF Chimera, label residues as name+specifier, selected ligand 8WX (= SCH28080), thus found 8WX lying betn. LEU 800.A & CYS 813.A • Next, selected ‘all nonstandard’ residues, deleted selected parts, then added H atoms with AddH from ‘Structure Editing’ Tools. Saved as file 5YLVclnH.pdb.
Prelim. Steps: with Chimera, ADT, etc. • Got structure of SCH28080 from PubChem(saved as XYZ, using Chimera). Drawn & g-optimised structure of pantoprazole in Avogadro, then exported as XYZ. • Using ORCA, QM-optimised both XYZ structures, then using Chimera, saved QM-opt XYZ files as PDB. • In ADT (only 1.5.6), set startup directory, opened refined 5YLVclnH.pdb, hidden its display as advised, then opened SCH28080.pdb as ‘Ligand Input’ and process it, as in ADT tutorial, till saving it as PDBQT. • Hiding ligand, process target till saving it as PDBQT.
Estimating & Defining Grid Box Position • Knowing ligand position in expt. L-bound complex, can estimate coordinates of grid box centre within cleaned, H-added finalised target PDBQT, as shown: • Can use default grid box size (40,40,40) ≡ 15 Å sides.
Final Docking: AutoDock, Aided by ADT • In ADT, further need define grid box, then set grid map types and save the ‘grid parameters file (GPF)’. • Aided by ADT, need run AutoGrid part of AutoDock. • With ADT, need choose docking search algorithm, etc., and save the ‘docking parameters file (DPF)’. • Aided by ADT, next can run AutoDock itself to get the docking output of AutoDock as a DLG (docking log) file, that describes the various docked poses. • In a new ADT session with target PDBQT opened, may visualise docked poses, as in said 2012 Tutorial.
Final Docking: With AutoDockVina • To run AutoDockVinain a CLI (e.g., Windows cmd), need copy the vina.exefile to an upper PC folder &prepare a configuration text file, say ConfigVina.txt. • The input target and ligand filenames and the Vina-output filename need be stated there in specific ways, along with grid box specifications, as:
Visualisation of AutoDockVinaOutput SCH28080 found bound to CYS 813.A & LEU 809.A, similar to its experimental known position near those!
Visualisation of AutoDockOutput SCH28080 found bound to CYS 813.A & LEU 811.A, similar to its experimental known position near those!
Processing Ligand & Target with ADT – 1 First, from File Preferences, need Set the Startup Directory, where we kept target and ligand PDB files.
Processing Ligand & Target with ADT – 2 From File Read Molecule option in ADT, open the cleaned and H-added target PDB file, say 5YLVclnH.pdb
Processing Ligand & Target with ADT – 3 Chosen colour scheme for target, ‘un-displayed’ it and opened ligand (say, SCH28080.pdb) as ‘Ligand Input’ (need look for PDB files!):
Processing Ligand & Target with ADT – 4 After doing the Ligand Torsion Tree Detect Root & Ligand Torsion Tree Choose Torsions steps, need go for Ligand Output Save as PDBQT step:
Processing Ligand & Target with ADT – 5 After un-displaying the ligand and displaying the target and pressing r n c in succession to reset target view, need do Grid Macromolecule Choose (the target):
Processing Ligand & Target with ADT – 6 ADT would now automatically lead us to save the processed target in the desired PDBQT file format:
Docking using these PDBQT files in Vina Knowing grid box position, can dock with AutoDockVina now, utilising these ligand and target PDBQT files:
Docking in Vina – Display of the Results The (L-T) binding affinity (in kcal mol–1), for the several docked poses predicted by Vina, gets shown in the CLI:
Docking in Vina – The Stored Result File The Vina output gets saved in its output PDBQT file (here vina_sch.pdbqt) that stores the several docked pose coordinates, with affinity values in REMARK lines:
For AutoDock– Need Further ADT Steps Opening the grid box from Grid Grid Box menu, need fill its centre’s (x,y,z) with our calculated values:
Docking in AutoDock– More ADT Steps The box is as seen! [We might also change numbers of pt. along axes.] To save it, File Close Saving Current:
Docking in AutoDock– More ADT Steps Next, need set AutoGrid parameters. Easy way: Grid Set Map Types Choose Ligand (Choose it) Select L..
Docking in AutoDock– More ADT Steps Need name Grid Parameters File with target name (say, 5YLVclnH.gpf) & Save, via Grid Output Save GPF (need write that full filename, including the .gpf part):
Docking in AutoDock– More ADT Steps Need run AutoGrid app now, via Run Run AutoGrid. There, first need Browse for Program Pathname, say in C:\Program Files (x86)\The Scripps Re..\Autodock\4.2.6\
Docking in AutoDock– More ADT Steps Next need Browse for the Parameter Filename, here just confirming the GPF filename in our startup folder!
Docking in AutoDock– More ADT Steps Ensuring that the (Grid) Log Filename (.glg) have got auto-filled fully, and not touching the Macro/Host Name, Nice Level & Cmd, need LaunchAutoGrid now:
Docking in AutoDock– More ADT Steps AutoGrid now runs for some seconds – mustn’t click Dismiss button but wait! Next, can verify .glgoutput:
Docking in AutoDock– More ADT Steps After verifying success of AutoGrid, need set AutoDock parameters. Need start as: Docking Macromolecule Set Rigid Filename (select the target .pdbqtfile). Next, Docking Ligand Choose (select it) Select L. Accept, then Docking Search Parameters Genetic Algorithm Accept, then finally Docking Output Lamarckian GA (need type the full.dpf filename, say SCH28080.dpf, first part same as ligand) Save. [Can now check the .dpf file with Notepad.] Next, can actually run AutoDock 4, from menu option Run Run AutoDock
Docking in AutoDock– Final ADT Step Running AutoDock in ADT is very similar to running AutoGrid. Need browse and set Program Filename (here …\autodock4.exe) and then Parameter Filename (here, ….\(ligand).dpf), ensuring Log file, then Launch:
Docking in AutoDock– The Final Result Here, need wait for several minutes for its completion! The output DLG (Docking LOG) file may be viewed and checked using Notepad. For the computed docked poses, the Estim. Free Energy of Binding are as seen:
AutoDock– Saving Best Pose as .pdbqt The DLG output, unfortunately, can’t be read by most other bio-modelling software, so we need convert the computed docked pose from DLG to PDBQT format! To do it using ADT, need open ADT afresh, then go for Analyze Dockings Open to open the DLG output.
AutoDock– Saving Best Pose as .pdbqt To get best (i.e., most stable - #1) docked pose, need: Analyze Conformations Play - ranked by energy. [Needn’t worry even if nothing is seen in screen!] It ’d get saved as .pdbqt with: File Save Write PDBQT
AutoDock– Saving Best Pose as .pdbqt To avoid confusing or overwriting the ligand .pdbqt file used as an input for docking, this output.pdbqtfile should be named differently, say like, AD4_SCH.pdbqt.
Part IVHow We Proceeded to Visualise the Ligand-Target Complex using PyMOLand Discovery Studio Visualizer
PyMOL – Joining Target & Ligand .pdbqt The docked output files have only docked ligand atom coordinates, don’t have the target ones! So, to have target & ligand atom positions together in a single file, we’d use PyMOL to combine both the target and the docked-ligand .pdbqt files into a single .pdb file. To do that, we first open PyMOL (may ‘Skip Activation’ for this shareware), then need first open the target .pdbqt file (say, 5YLVclnH.pdbqt, via File Open), then immediately need open also the docked-output ligand .pdbqtfile (say, Vina_SCH.pdbqt), then to save the joined complex, need do File Export Molecule, as:
PyMOL – Joining Target & Ligand .pdbqt Keeping the given Save options, file type be taken as PDB:
PyMOL – The Joined Target-Ligand PDB Let joined PDB be duly named, say as 5YLV_SCH_Vina.pdb
PyMOL – Interaction Visualisation Facility Attractive visualisation of the target-ligand interactions may be done in PyMOL, as shown in the image below (for a different system). If interested, may see my Docking… Guidebook, also from sites.google.com/view/chemistry-rk
BDS Visualizer – Visualising Interactions Using the BIOVIA Discovery Studio Visualizer, informative visualisation and analysis of the interactions of the docked ligand with nearby receptor (i.e., target) atoms is possible. For that, need open the Visualizer, ensuring that its top panel’s Receptor-Ligand Interactions tab remains open.
BDS Visualizer – Visualising Interactions Need open the combined PDB (say, 5YLV_SCH_Vina.pdb), then rotate and zoom it to see the ligand, then click on a bond/atom of that to select the ligand (as seen). Define Ligandoption on the left panel glows; need double-clickit.
BDS Visualizer – Visualising Interactions Next, need click at Ligand Interactions to view the ligand interactions with nearby parts of target. To better view, need click at the blank screen, then at Color, then Background, then choose white colour and click OK. To add labels to nearby target residues, need click at blank screen, then Labels, then Add, thus getting a dialogue box:
BDS Visualizer – Visualising Interactions In the dialogue box for label options, may choose the Residue option for Object and, preferably, 3-Letter & ID# option for Attribute. The interactions get nicely displayed:
BDS Visualizer – Visualising Interactions To see the distances (in Å) and the types (say, pi-alkyl) for the displayed ligand-target interactions, need click at the Show Distances and the Show Types options on left panel. Carefully rotating the display, we get a nicely labelledvisualisation of interactions, as was there in the Overview: