Download
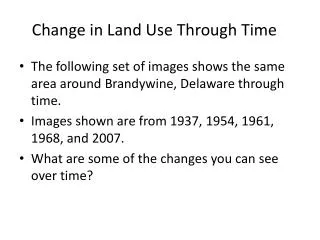
1 / 46
460 likes | 656 Views
Modeling Land Use Change in Chittenden County, VT. Austin Troy*, Associate Professor, austin.troy@uvm.edu Brian Voigt*, PhD Candidate, brian.voigt@uvm.edu www.uvm.edu/envnr/countymodel *University of Vermont Rubenstein School of Environment and Natural Resources. Agenda.

E N D
Modeling Land Use Change in Chittenden County, VT Austin Troy*, Associate Professor, austin.troy@uvm.edu Brian Voigt*, PhD Candidate, brian.voigt@uvm.edu www.uvm.edu/envnr/countymodel *University of Vermont Rubenstein School of Environment and Natural Resources
Agenda 8-8:30 continental breakfast 8:30-8:45 opening remarks 8:45-9:30 presentation on UrbanSim model and discussion of preliminary model runs 9:30-9:45 Q&A 9:45-10:00 break 10:00-11:00 scenario breakout groups 11:00-11:30 presentation of scenario results and wrap-up
Team and Collaborators • Graduate researchers: Brian Voigt, Alexandra Reiss, Brian Miles, Galen Wilkerson, Ken Bagstad • Co-PIs: Adel Sadek, Breck Bowden, Jon Erickson • Collaborating organizations: • Chittenden County Regional Planning Commission • Chittenden County Metropolitan Planning Organization • Resource Systems Groups, Inc, White River Junction, VT • University of Washington Center for Urban Simulation and Policy Analysis: Paul Waddell, Alan Borning, Hana Sevcikova, Liming Wang
Project Support • Dynamic Transportation and Land Use Modeling • Funder: USDOT Federal Highway Administration • Integrated Land-Use, Transportation and Environmental Modeling: Complex Systems Approaches and Advanced Policy Applications. • Funder: UVM Transportation Center • Co Lead Investigator: Adel Sadek
Research Questions • What will land use patterns in Chittenden County look like in 20-30 years? • What effect will future urban development patterns have on environmental quality? • How might alternative policies alter these outcomes? • How can we develop a model framework that effectively integrates the (inter)actions of households, employers, developers, transportation, and the environment?
This project … • IS • A model development and integration exercise • An opportunity to visualize and assess the range of land use outcomes resulting from alternative policies in Chittenden County • A chance to explore how modeling tools can fit into the regional planning process • IS NOT • An adopted planning tool by any agency • An attempt to predict future land use policy • Part of the regulatory process • An analysis of any immediately proposed policies
Modeling Framework • UrbanSim: Land use model - www.urbansim.org • TransCAD (Caliper Corp.): four step travel demand model • Suite of indicators and environmental modules • Plans to also integrate with TranSims (FHWA) and TransModeler (Caliper, Corp.) agent-based transportation models in coming year. This effort led by Adel Sadek, RSG, Inc and Austin Troy.
Database Output / Indicators Model Coordinator Scenario Data Control Totals TDM Exogenous Data The Five D’s of UrbanSim • Data-intensive • Disaggregated • Dynamic • Disequilibrium • Driven by trends and forecasts
Modeling with UrbanSim • Model parameters based on statistical analysis of historical data • Integrates market behavior, land policies, infrastructure choices • Simulates household, employment and real estate development decisions • agent-based for household and employment location decisions • grid-based for real estate development decisions from Waddell, et al, 2003
Grid_ID:23674 HSHLD_ID: 23 AGE_OF_HEAD: 42 INCOME: $65,000 Workers: 1 KIDS: 3 CARS: 4 Grid_ID:23674 Households: 9 Non-residential_sq_ft: 30,000 Land_value: 425,000 Year_built: 1953 Plan_type: 4 %_water: 14 %_wetland: 4 %_road: 3 Grid_ID: 60211 Employment_ID: 427 Sector: 2 Employees: 135 UrbanSim Decision Makers
UrbanSim Model Algorithms Accessibility Land Price Mobility & Transition DATABASE Location Choice Real Estate Development Residential Land Share • Input Data • Economic • land value, employment • Structures • Residential and non-residential, size, year built • Biophysical • topography, soils, wetlands, flood plains, water • Infrastructure • roads, transit, travel time to CBD, distance to Interstate • Planning& zoning • land use, development constraints • Households • age of head of household, income, race, # of autos, children • Employment • employment sector, number of employees • Control Totals • people: total population, # of households • jobs: # of jobs by employment sector
Importance of Accessibility • Location choice for employers, households is strongly determined by accessibility • Accessibility changes over time • Development follows those preferences from Waddell, et al, 2003
Modeling with UrbanSim Accessibility Accessibility Land Price Land Price Mobility & Transition Mobility & Transition Location Choice Location Choice Real Estate Development Real Estate Development • movers • vacant units • probabilities • site selection Residential Land Share Residential Land Share
Scenario Input Data DATABASE DATABASE Travel Demand Model Travel Demand Model Indicators Time Accessibility Accessibility Land Price Land Price Mobility & Transition Mobility & Transition Location Choice Location Choice Real Estate Development Real Estate Development Residential Land Share Residential Land Share
Output database: defines grid cell state Indicators Graphics maps charts tables Households by Grid Cell: 2000 Model Output
Standard Indicators • Transport: VMT, accessibility • Land use: vacancy, non-residential sq ft • Land value: residential, commercial, industrial • Population: total, density, summarize by area (e.g. block group, TAZ) • Households: count, type, income • Employment: count, type, sector
Initial model runs: assumptions • Development constraints: limit development in low density residential zones and cells with high % wetlands, no building on public lands • Employment sector: base year employment data from VT Sec of State business data and Claritas Business data • Households: base year households synthesized from 1990 US Census and PUMS 5% sample • Population and employment control totals from RPC/MPO • Starting and ending year: 1990 - 2020 • Different versions of model • With and without travel model • No constraints, minor constraints, significant constraints
Residential Units Per Grid Cell: 1990 - 2015 Residential Units 1990 1995 2000 2005 2010 2015 Constrained by development type + travel model Constrained by development type, no travel model
90 = Limited constraints + travel model 114 = Limited constraints, no travel model
90 = Limited constraints + travel model 114 = Limited constraints, no travel model
Population Density by Town: 1995 - 2015 People / Acre 1995 2000 2005 2010 2015 Constrained by development type + travel model Constrained by development type, no travel model
Environment Indicators • Developing sub-modules that use UrbanSim output to estimate environmental impacts • Nutrient export (done) • Habitat fragmentation • Stormwater (Breck Bowden/Mary Watzin)* • Mobile source emissions (RSG Inc)* • Road particulate impacts (Sarah Lovell)* • Carbon footprint analysis (Jen Jenkins)* • Energy usage (Troy)* *part of UVM Transportation Signature Project 1
UrbanSim Nutrient Indicators • Limited constraints, no travel model • The total nutrient load in 2020 would increase to 62150 kg/yr from 1992 levels (58527 kg/yr) • Calculated from Lake Champlain Basin Program nutrient export coefficients • Increase of 5 residential units in one gridcell equals transition to “urban” land use type Troy et al. 2007 “Updating the Lake Champlain Basin land use data to improve prediction of phosphorus loading”, Lake Champlain Basin Program
Other Planned Components • Network Robustness analysis (David Novak)* • “Sketch model” for comparison, communication, and scenario development (Roel Boumans)* • Complexity/ sensitivity analysis for combined model framework (Adel Sadek, Chris Danforth, Peter Dodds, Jun Yu)* • Integrations with ARIES artificial intelligence-based data mining framework (Ferdinando Villa) * Part of UVM UTC Signature Project 1
The to do list … • This is a model in progress; although it’s running, it will be undergoing many improvements with time: • Fix commercial sector model • Improve multi-city zoning inputs • Improve non-residential building data and per employee square footage • Review the base year database • Expand development constraints • Finalize model estimation • Perform validation: 1990 – 2000 • Develop scenario data
employment event alter transport infrastructure employment opportunity establish growth center(s) increase density UrbanSim and Scenario Analysis investment • What is a scenario? • Alteration of baseline model inputs and assumptions • Types of changes that can be assessed • Zoning • Transportation investments • Non-transportation capital investments • State and regional policy • Economic and demographic changes • Behavioral assumptions BASE YEAR – business as usual policy event 1 policy event 2 * need TranSims for this analysis
Scenarios: types of things that can be modeled • Constraints to development • Rules for density, use, coverage, zoning • Macro-scale transportation network (e.g. highways, onramps, roundabouts, etc.) • Micro-scale transportation network (e.g. new lanes, turning rules, ITS, speed limits) • Placement of public facilities (e.g. hospitals, schools, courts, parks, arena, airports, etc.) • Infrastructure (e.g. sewer, water, electricity) • Siting of major employers/employment centers • Control totals * need TranSims for this analysis
Scenarios: types of things that can be modeled • Building assumptions (e.g. square footage/employee, size of house relative to family size) • Transportation behavioral assumptions (e.g. trip chaining, carpooling, mode share, response of mode share to upgrades in service) • Speculative behavior assumptions (response of developers to new permitting rules, response of commuters and land market to high oil prices, response of shoppers or employers to greatly reduced parking) * need TranSims for this analysis
Five scenarios for today • Based on input from last workshop and on what we think is technically feasible • Transportation corridor-oriented development • County-wide growth center implementation • Investment for increased regional road connectivity • Population boom • Ultra Green
Scenario 1: Transportation Corridor-Oriented Development • Your task is to develop specific recommendations about land use and transportation for three corridors: route 7, route 2 and route 15. • How wide is the “corridor planning area?” This is up to you to decide. • There is a separate map for each corridor. Break into subgroups for each corridor if needed. • Feel free to build on existing corridor plans
Scenario 1: Transportation Corridor-Oriented Development • Types of actions that could be proposed: • redefine zoning district boundaries for the corridors • change allowable densities, uses and lot coverage within them • Propose major roadway upgrades, like lane additions, roundabouts, divided highways
Scenario 1: Transportation Corridor-Oriented Development • Propose pedestrian or bike paths • Propose non-infrastructural transportation upgrades and investments in the corridors, such as changes to public transportation lines and implementation of intelligent transportation systems to improve traffic flow • Propose other capital investments for these areas, like new transit center/stops, government buildings, auditoriums, schools, parks, sewer lines, etc.
Scenario 2: Growth Centers • This scenario is designed to imagine what it would look like if the growth center concept was implemented to the greatest feasible extent in Chittenden County • Takes established Williston growth center as given; prospective Colchester growth center boundary is mapped but open to alteration in this exercise • It is up to the group to decide how many growth centers there will be and how large
Scenario 2: Growth Centers • Potential types of detail that could be prescribed • Number, size and boundaries of growth center districts • Sub-districts • Allowable uses, densities, lot coverage, zoning, etc. for centers or sub-districts • Transportation network upgrades (lanes, roundabouts, signals, ITS, etc.) • Public transit stops or lines • Infrastructure investments (sewer, water, parking etc.) • Changes to allowable uses/densities outside centers • Parking regulations • Other capital investments for these areas: transit center/stops, new parking, government buildings, auditoriums, schools, parks, sewer lines, etc
Scenario 3: Investment for Increased Regional Road Connectivity • Participants will propose a set of road network enhancements that would increase connectivity between major corridors at the County level • Put differently: where are locations that are harder to access than they should be? • Can go off of list of MPO potential projects or define new project ideas • Results should be drawn on map and described in notes
Scenario 3: Investment for Increased Regional Road Connectivity • Potential types of prescribed projects • New interstate exits/interchanges • Through access to PUDs located between major corridors, but with access only to one • Upgrade of smaller order roads to arterial capacity • Adding east-west connectors between major north-south corridors (e.g. Route 7, Spear and Dorset, 116). • Adding north-south connectors between major east-west corridors Route 15 and Route 2
Scenario 4: Population Boom • Model used for this project takes population and employment growth forecasts as given. • Changes to those forecasts have a large impact on simulated future land use patterns. • Participants will imagine a Chittenden County with a far larger influx of people than our forecasts predict, due to some unexpected influence (e.g. migrations due to global warming). • New forecasts will include estimates of the demographic breakdown of the new population, plus the employment sectors likely to see increases and reductions in jobs. • To accommodate this added growth, however, zoning will have to change. • The participants in this group will present one or two simple county-wide macro-scale zoning change alternatives that would be expected to accommodate that growth in residents and employment.
Scenario 5: Ultra-green • This scenario represents a hypothetical set of regulations and investments designed to maximize the amount of green space in the County while minimizing the population's environmental footprint. • Be creative: don’t get too caught up in feasibility or practicality • Participants are encouraged to focus on a set of coordinated regional actions
Scenario 5: Ultra-green • Possible types of policies to consider: • urban growth boundary, • significantly increased densities for established urban centers, • new modes of public transportation, • gas and energy taxes, etc. • open space acquisition • You’ll get a map showing all the large undeveloped parcels and their acreage • We’ll give you a hypothetical cost/acre and a budget to work from
General Breakout Session Guidelines • Try to be as specific as possible • Keep in mind what can feasibly be simulated in modeling environment • Present results after about 55 minutes. Leave 5 minutes for brief changeover to full group • Draw on maps with colored pens to illustrate; we’ll digitally photograph at end and they can be projected for final presentation • Feel free to use any planning documents • Don’t feel constrained by current land use regulations • Designate note taker and keep official notes to submit to organizers • Be creative; don’t feel constrained.
Communicating our results • Your outputs will be extensively documented (video, notes, maps) • We will write up the details of the scenarios and post them on our website (www.uvm.edu/envnr/countymodel) within two weeks • Where not feasible, we will so note in the online documentation • We will begin working on developing the scenario inputs in parallel with improving the baseline model
Communicating our results • The website will contain information about updates and improvements in the models • We will notify workshop participants when we have a “stable release” of the baseline model for which we anticipate only minor modifications • At this point we will run the five scenarios defined today and then post the results. • The website will provide detailed results and downloadable data (maps, GIS layers, tables) from the baseline and alternative models. • We invite your involvement in this process
THANKS FOR YOUR PARTICIPATION!!www.uvm.edu/envnr/countymodel