Download
1 / 24
240 likes | 492 Views
Is Poverty the Greatest Predictor of Health Status?. Barbara T. Baylor, MPH Minister for Health Care Justice Justice and Witness Ministries United Church of Christ October 19, 2009. Objectives:. Some understanding of the Poverty and how it is measured and computed

E N D
Is Poverty the Greatest Predictor of Health Status? Barbara T. Baylor, MPHMinister for Health Care Justice Justice and Witness Ministries United Church of Christ October 19, 2009 Developed by Barbara T. Baylor, MPH Minister for Health Care Justice-UCC/JWM 2009
Objectives: • Some understanding of the Poverty and how it is measured and computed • Some understanding of health status • Raise awareness about the extent and cost of health inequities • Some understanding of the Social Determinants of Health Developed by Barbara T. Baylor, MPH Minister for Health Care Justice-UCC/JWM 2009
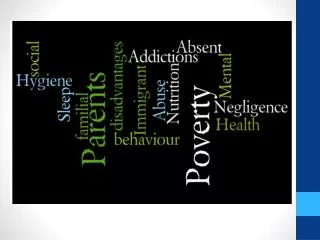
Faces of Poverty Developed by Barbara T. Baylor, MPH Minister for Health Care Justice-UCC/JWM 2009
Poverty & Health Overview • Loss of purchasing power • Poor housing • Overcrowding, greater liability to accidents in cramped homes and in the street • Violence • Diet (even if adequate in quantity may be deficient in quality and lacking in expensive “protective” foods such as food and vegetables.Community Health in the 21st Century. Patricia Reagan and Jodi Brookins-Fisher Developed by Barbara T. Baylor, MPH Minister for Health Care Justice-UCC/JWM 2009
Higher rates or premature death • Tend to die younger • Frequently ill • Had less time disability free • Less happy • Endure inadequate housing, clothing and food • Workplaces that are frequently hazardous • Limited recreational opportunities • Inaccessible health system Developed by Barbara T. Baylor, MPH Minister for Health Care Justice-UCC/JWM 2009
Persons in the Family 1 2 3 4 5 6 7 8 Poverty Guideline $10,830 $14,570 $18,310 $22,050 $25,790 $29,530 $33,270 $37,010 U.S. Census Bureau 2009 Poverty Guideline48 Contiguous States and D.C. Developed by Barbara T. Baylor, MPH Minister for Health Care Justice-UCC/JWM 2009
Money income Includes earnings, unemployment compensation, workers’ compensation, Social Security, Supplemental Security Income, public assistance, veterans’ payments, survivor benefits, pension or retirement income, interest, dividends, rents, royalties, income from estates, trusts, educational assistance, alimony, child support, assistance from outside the household, and other miscellaneous sources. • Noncash benefits (such as food stamps and housing subsidies) do not count. U.S. Census Bureau Developed by Barbara T. Baylor, MPH Minister for Health Care Justice-UCC/JWM 2009
Before taxes. • Excludes capital gains or losses. • If a person lives with a family, add up the income of all family members. (Non-relatives, such as housemates, do not count.) U.S. Census Bureau Developed by Barbara T. Baylor, MPH Minister for Health Care Justice-UCC/JWM 2009
Poverty thresholds are the dollar amounts used to determine poverty status • Each person or family is assigned one out of 48 possible poverty thresholds • Thresholds vary according to: • Size of the family • Ages of the members • The same thresholds are used throughout the United States (do not vary geographically) • Updated annually for inflation using the Consumer Price Index for All Urban Consumers (CPI-U). U.S. Census Bureau Developed by Barbara T. Baylor, MPH Minister for Health Care Justice-UCC/JWM 2009
If total family income is less than the threshold appropriate for that family, • the family is in poverty • all family members have the same poverty status • for individuals who do not live with family members, their own income is compared with the appropriate threshold • If total family income equals or is greater than the threshold, the family (or unrelated individual) is not in poverty U. S. Census Bureau Developed by Barbara T. Baylor, MPH Minister for Health Care Justice-UCC/JWM 2009
Family A has five members: two children, their mother, father, and great-aunt. • Their threshold was $26,338 dollars in 2008. (See poverty thresholds for 2008) • Suppose the members' incomes in 2008 were: Mother: $10,000 Father: $ 7,000 Great-aunt: $10,000 First child: 0 Second child: 0 Total family income: $27,000 U.S. Census Bureau Developed by Barbara T. Baylor, MPH Minister for Health Care Justice-UCC/JWM 2009
Compare total family income with their family's threshold. Their income / Threshold = $27,000 / $26,338 = 1.03 • The income divided by the threshold is called the Ratio of Income to Poverty. • Since their income was greater than their threshold, Family A is not "in poverty" according to the official definition. U.S. Census Bureau Developed by Barbara T. Baylor, MPH Minister for Health Care Justice-UCC/JWM 2009
The poverty thresholds were originally developed in 1963-1964 by Mollie Orshansky of the Social Security Administration. Published in a January 1965 Social Security Bulletin article. Orshansky based her poverty thresholds on the economy food plan — the cheapest of four food plans developed by the Department of Agriculture Source: Brief Overview of the U.S. Poverty Threshold. DHHS. Gordon M. Fisher Developed by Barbara T. Baylor, MPH Minister for Health Care Justice-UCC/JWM 2009
Some Health Facts • 47 million uninsured (25 million underinsured; 5 million uninsured. • Spend approx. $6,697 per person on health care in this country. Over 2 Trillion dollars • Among the worst health outcomes of any industrialized nations • Greatest health inequities. • High Chronic conditions Developed by Barbara T. Baylor, MPH Minister for Health Care Justice-UCC/JWM 2009
Developed by Barbara T. Baylor, MPH Minister for Health Care Justice-UCC/JWM 2009
The Social Determinants of Health • The social determinants of health are the conditions in which people are born, grow, live, work and age, including the health system. These circumstances are shaped by the distribution of money, power and resources at global, national and local levels, which are themselves influenced by policy choices. Source: World Health Organization (WHO) Developed by Barbara T. Baylor, MPH Minister for Health Care Justice-UCC/JWM 2009
Social Determinants of Health • Jobs • Working conditions • Education • Housing • Social inclusion • Political power Developed by Barbara T. Baylor, MPH Minister for Health Care Justice-UCC/JWM 2009
What is Health Equity? • Those differences in population health that can be traced to unequal economic and social conditions and are systemic and avoidable – thus inherently unjust and unfair.Source: Unnatural Causes: Is Inequality Making Us Sick? Developed by Barbara T. Baylor, MPH Minister for Health Care Justice-UCC/JWM 2009
The Mystery: • Given our wealth and medical advances, why does the United States rank 29th in the world for life expectancy (as of December 2007)? • What are the connections between healthy bodies and healthy bank accounts and race/ethnicity?Source:Unnatural Causes: Is Inequality Making us Sick? Developed by Barbara T. Baylor, MPH Minister for Health Care Justice-UCC/JWM 2009
Themes to Consider: • Class status correlates with health outcomes • Our economic, social and built environments shape health • People who are middle to lower on the class pyramid are exposed to more health threats (material deprivation and chronic stressors) and have less access to the opportunities and resources needed to control their destinies. Developed by Barbara T. Baylor, MPH Minister for Health Care Justice-UCC/JWM 2009
People middle to higher on the class pyramid have access to more power and resources and in general live longer, healthier lives. • Chronic activation of the body’s stress response wears down our organs over time and increases disease risk. • Racism also threatens health, both “upstream” and independent of class. • Social and economic policies have reduced health inequities in the past and in other countries. Unnatural Causes Developed by Barbara T. Baylor, MPH Minister for Health Care Justice-UCC/JWM 2009
Layoffs, unemployment, and job insecurity have a negative effect on health.Public policies that provide a social safety net can buffer unemployed workers and their families from economic disruptions and uncertainties that affect health. • Societies that take a “we’re all in this together’ approach to policy have better health outcomes than those that leave individuals and communities to fend for themselves. Unnatural Causes Developed by Barbara T. Baylor, MPH Minister for Health Care Justice-UCC/JWM 2009
“The choices that people make are shaped by the choices they have.”Source: Unnatural Causes: Is Equality Making Us Sick? Developed by Barbara T. Baylor, MPH Minister for Health Care Justice-UCC/JWM 2009
“Of all the forms of inequality, injustice in health care is the most shocking and inhumane.”Rev. Dr. Martin Luther King, Jr. Developed by Barbara T. Baylor, MPH Minister for Health Care Justice-UCC/JWM 2009