Download
1 / 38
380 likes | 638 Views
The Rock’s First-Year Students The Freshman Survey Results and the Millennial Generation “The found generation” “The generation of promise” “Chilling out and Cheering up”. The presentation outlines characteristics of the Millennial Generation and results from the 2007 Freshman Survey.

E N D
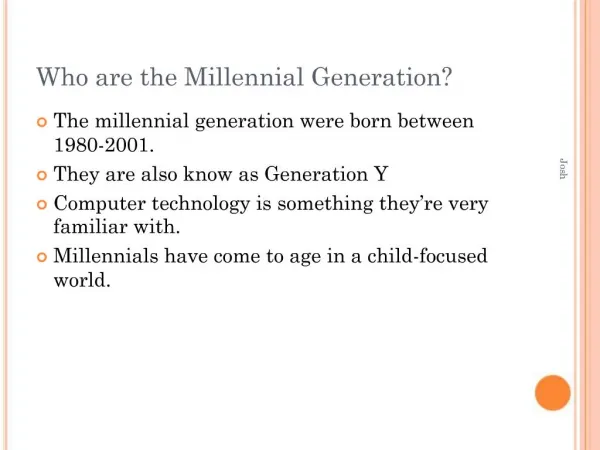
The Rock’s First-Year StudentsThe Freshman Survey Results and the Millennial Generation“The found generation”“The generation of promise”“Chilling out and Cheering up” • The presentation outlines characteristics of the Millennial Generation and results from the 2007 Freshman Survey. • Howe and Strauss (2000) describe the Millennial generation as one which is intent on making the world a better place and creating a future full of hope(Millennials Rising – The Next Generation). • The Freshman Survey provides a summary of our incoming students’ attitudes, aspirations, and behaviors as they entered Slippery Rock University in Fall 2007. • The Most Watched-Over Generation in History – Source: Howe and Strauss (2000) Millennials Rising – The Next Generation • Projected to be the largest generation to date – Source: Sandfoot and Haworth (2004) Whassup? A Glimpse Into the Attitudes and Beliefs of the Millennial Generation
76% - report that SRU is their first choice (78% in 2005; 79% in 2004) [19.7% report that SRU is their second choice (18% in 2005; 17% in 2004)] 57.7% - Public 4yr Colls-low students state is first choice 64.2% - All Public 4yr Colls state is first choice 92.8% - of SRU student report they were accepted by their first choice 80.6% - of Public 4yr Colls-low students report they were accepted by their first choice 84.2% - of All Pub 4 yr Colls students report they were accepted by their first choice 36% - apply to three or more colleges (54% in 2005; 52% in 2004) [28.8% applied only to SRU (27% in 2005; 30% in 2004)] 40% - live within 50 miles from SRU (36% in 2005; 36% in 2004) [4.9% live within 10 miles (1% in 2005; 4% in 2004) and 28% live 100 or more miles (28% in 2005; 27% in 2004) from SRU] 60% - choose SRU because of the institution’s ‘very good’ academic reputation (most common response for selecting SRU) (54% in 2005) 45.1%- indicate that a campus visit was a “very important” influence of the decision to attend SRU (46% in 2005) 7.6% of SRU students report national magazine rankings as a ‘very important’ factor influencing their decision to attend (7% in 2004 and 4% in 2003). “Information from a website” was noted by 14% as “very important” in influencing a student’s decision to attend SRU. What do we know about the traditionally-aged SRU student?(The Freshman Survey, 2007)
Top 6 “Very Important” reasons for selecting SRU Very good academic reputation - 60% (54% in 2005) College’s graduates get good jobs - 52% (52% in 2005) Cost of attending this college – 48% (47% in 2005) A visit to campus– 45% (46% in 2005) Size of SRU – 41% (42% in 2005) Good reputation for social activities – 36% (32% in 2005) Why do students choose SRU?
Not offered financial aid by first choice – 4.5%(3.1% in 2005) Teacher advised me – 5.0%(5.3% in 2005) High school guidance counselor advised me – 6.7% (5.9% in 2005) My relatives wanted me to come here – 3.0% (7.4% in 2005) Early Action/Decision Program – 6.9% (8.5% in 2005) Lower ratings of “very important” factors influencing a student’s decision to attend SRU
39.8% (36%-2005) of fathers report having a 4 yr degree or higher 37% (38%-2005) of mothers report having a 4 yr degree or higher 71.4% (73% in 2005, 72% in 2004) - homes where both parents are living together 67.7% (74%in 2005, 76% in 2004) - some concern/major concern about financing college First Generation
How involved were the students parents or legal guardians in their: • Decision to go to college: • 5.4% - Too little • 86.8% - Right amount • 7.8% - Too much • Application(s) to college: • 13.9% - Too little • 76.7% - Right amount • 9.4% - Too much • Decisions to go to SRU: • 10.1% - Too little • 82.6% - Right Amount • 7.3% - Too much • Dealings with officials at SRU: • 13.1% - Too little • 81.8% - Right Amount • 5.0% - Too much • Choosing college courses: • 15.9% - Too little • 80.6% - Right amount • 3.5% - Too much • Choosing college activities: • 15.7% - Too little • 78.9% - Right amount • 5.4% - Too much
Alumni • Either parents or legal guardians attended SRU: • 92.1% - Neither • 2.7% - Mother or female legal guardian only • 3.3% - Father or male legal guardian only. • 1.8% - Both
Academic expectations are at an all-time high • 63.1% - plan to continue their education beyond a bachelors degree (58% in 2005, 59% in 2004 & 56% in 2001) • 34.9% - plan to attend SRU to extend their education (31% in 2005 & 30% in 2004) Characteristic of Millennials High Academic Expectations
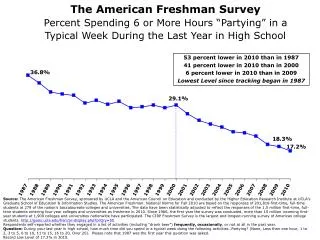
Academic expectations • 94.2% - self-report their high school grade average to be at the A-B level (95% in 2005, 95% in 2004 & 91% in 2003) and 36.4% report A or A- average in high school (34% in 2005 & 33% in 2004) • 55.8% report spending 2 or less hours studying weekly in high school (61% in 2005 & 56% in 2004). • Over 82.9% report having studied no more than 5 hours per week in their senior year (85% in 2004 & 2005). • Less than 2% report spending 16 or more hours weekly studying in high school (2% in 2005 & 3% in 2004). Characteristics of Millennials More are doing homework
Major Program Aspirations • 12.1% (12% in 2005) of all students estimate that they will change their major even before they enter college and 11.2% (11% in 2005) of all students estimate that they will change their career choice
Academic EngagementEven though students have higher levels of academic expectations, there continue to have higher levels of academic disengagement – or –Should we be redefining academic engagement? • 83% (85% in 2005) studied or completed homework for 5 or less hours weekly [23% reported less than one hour (30% in 2005 & 25% in 2004) and 56% reported less than 2 hours (61% in 2005 & 56% in 2004)] • 43% bored in class (45% in 2005 & 49% in 2004) • 56% came late to class (60% in 2005) • 18% read for pleasure 3 hours or more weekly in their senior year (16% in 2005) • 67% talked with teachers less than one hour outside of class (64% in 2005) • 19% reported being a guest in a teacher’s home (24% in 2005) • 21% asked teacher for advice after class (22% in 2005)
Civic Engagement Activity in Last Year -- • 49% performed community service as part of a class (48% in 2005) • Amount of time that students participated in volunteer work in the last year of high school: • 33.2% - none • 25.5% - Less than one hour • 22.7% - 1 to 2 hours • 10% - 3 to 5 hours • 4.4% - 6 to 10 hours • 4.2% - 11+ hours • 17.9% plan to volunteer or do community service work in college (18% in 2005)
Top 10% - Highest 73.1% - Cooperativeness (74% in 2005) 68% - Drive to Achieve (68% in 2005) 65.3% - Understanding of Others (64% in 2005) 62.8% - Physical Health (64% in 2005) 59% - Leadership Ability (63% in 2005) Self Ratings of Students The Freshman Survey Characteristic of Millennials
Most Frequent Objectives considered to be “essential” or “very important”The Freshman Survey • Being very well off financially (80% in 2005) 80.3% • Raising a family (78% in 2005) 79.2% • Helping others who are in difficulty (67% in 2005) 69.7% • Becoming an authority in my field (57% in 2005) 57.8% • Obtaining recognition from colleagues 56.7% for contributions to field (54% in 2005) • Having administrative responsibility for 39.2% the work of others (39% in 2005) • Influencing social values (38% in 2005) 40.3% • Becoming successful in own business (34% in 2005) 34.1% • Developing meaningful philosophy of life (33% in 2005) 41.7% • Becoming a community leader (29% in 2005) 30.2% The Millennials’ college experience is being marked by parents who give new meaning to “overprotective.” “Picture the parents who watch youth soccer becoming the parents watching the admissions process – with the stakes even higher.”
drinking beer decreased (36% in 2007, 48% in 2005, 47% in 2004, 39% in 2003, and 55% in 1999) drinking wine/liquor decreased (41.2% in 2007, 52% in 2005 44% in 2003, 47% in 2001, and 59% in 1999) cigarette smoking decreased (4.4% in 2007, 8% in 2005, 9% in 2004, 14% in 2001 and 16.9% in 1999. agreeing that marijuana should be legalized decreased (30.2% in 2007, 33% in 2005 and 35% in 2004 and 2001) Drinking, Cigarette Smoking, Use of MarijuanaIn the student’s senior year of high school the rate of …
Gender Differences - Student estimates chances are “very good” that he/she will: Men Women Make at least a B average 57% 63% Socialize with someone of another 48% 66% racial/ethnic group Get a job to pay for college 48% 63% Be satisfied with college 44% 59% Participate in clubs/groups 26% 47% Play varsity/intercol. athletics 24% 16% Communicate regularly with professors 23% 27% Participate in volunteer/comm 11% 23% service work Participate in study abroad 9% 20% Join a social fraternity/sorority 4% 6% Participate in stud. government 4% 6% Transfer to another college before 4% 4% graduation Nationally and locally, first to second year retention rates for men are lagging behind women. Some of these incoming factors may help us to identify reasons for this trend and assist us in engaging them more in the college experience at SRU. As women increasingly take over leadership of student government and clubs, men flee academe for the workplace. (Chronicle of Higher Education, October 13, 2000) John N. Gardner, executive director of the Policy Center on the First Year of College at Brevard College says that the trend is already underway….”It’s the biggest change I’ve seen on campuses in 33 years.”
Gender Differences - Student Self-Ratings (Students self-report they are “above average” or in top 10%) Men Women Drive to Achieve 66% 69% Self-confidence (social) 62% 49% Self-confidence (intellect) 67% 47% Self-understanding 61% 48% Physical Health 75% 54% Emotional Health 61% 47% Academic Ability 61% 61% Mathematical Ability 41% 31% Writing Ability 38% 50% Leadership Ability 66% 56% Computer Skills 44% 33% Understanding Others 61% 69% Creativity 49% 52%
Gender Differences – Activities During Senior Year of High School Men Women Tutored another student 40% 48% Studied with other students 76% 89% Felt overwhelmed by all they 12% 33% they had to do Felt depressed 4% 7% Performed volunteer work 74% 83% Played a musical instrument 36% 38% Asked teacher for advice 18% 24% after class Discussed politics 26% 19% Millennial Characteristic A “Doing” Generation
Gender Differences - Student agrees “strongly” or “somewhat” that… Men Women • Abortion should be legal 49% 44% • Death penalty should be abolished 19% 29% • Important to have laws prohibiting homosexual 41% 18% relationships • Fed government should control sale of handguns 57% 81% • Racial discrimination is no longer a problem 29% 19% • Same-sex couples have the right to legal 44% 69% marital status • Affirmative action in college admissions should 44% 34% be abolished • Federal government is not doing enough to control 69% 79% environmental pollution • A national health care plan is needed to cover 73% 82% everybody’s medical costs • Undocumented immigrants should be denied access 65% 54% to public education
Students reported the “frequently” did the following in the past year:
Ethnicity • Students identify themselves as being: • 93.2% - White/Caucasian • 9.4% - Students of Color • 1.5% - Other
Racial Composition of: • The high school last attended • 1.2% - Completely non-White • 3.1% - Mostly non-White • 13.5% - Roughly half non-White • 68.9% - Mostly White • 13.4% - Completely White • Neighborhood where grew up • 1.6% - Completely non-White • 3.8% - Mostly non-White • 6.7% - Roughly half non-White • 54.7% - Mostly White • 33.1% - Completely White
Computers • Amount of time students spent playing video games/computer games during a typical week: • 42.8% - None • 23.8% - Less than one hour • 14.3% - 1 to 2 hours • 10.5% - 3 to 5 hours • 4.6% - 6 – 10 hours • 4% - 11+ hours • Amount of time students spent on online social networks (Facebook, MySpace, etc.) during a typical week: • 16.5% - None • 20.8% - Less than one hour • 25.2% - 1 to 2 hours • 20.4% - 3 to 5 hours • 9.3% - 6 to 10 hours • 7.7% - 11+ hours • In the past year, the student has done these activities: • Used the internet: • 70.7% - For research or homework • 37.4% - To read news sites • 31.8% - To read Blogs
Tutoring or Remedial work • Had any special tutoring or remedial work in: • English – 5.0% • Reading – 4.3% • Mathematics – 14.9% • Social Studies – 3.2% • Science – 4.8% • Foreign Language – 5.2% • Writing – 3.7% • Feels that will need any special tutoring or remedial work in: • English – 8.4% • Reading – 3.9% • Mathematics – 26.2% • Social Studies – 3.2% • Science – 9.7% • Foreign Language – 9.3% • Writing – 8.9%
Advance Placement • AP Courses taken in high school: • 4.7% - Not offered at my high school • 49.2% - None • 43.3% - 1 to 4 • 2.6% - 5 to 9 • .1% - 10 to 14 • .1% - 15+ • AP Exams taken in high school: • 6.25% - Not offered at my high school • 69.3% - None • 23.8% - 1 to 4 • .7% - 5 to 9 • 0.0% - 10 to 14 • .1% - 15+
Additional Courses • Since leaving high school, students that have taken courses, whether for credit or not for credit, at any other institution
How much of first year’s educational expenses do students expect to cover from: • Students concerned about the ability to finance their college education: • 32.3% - Confident that there will be sufficient funds • 61.5% - Probably will have enough funds • 6.2% - Not sure if will have enough funds to complete college
Student Life in High SchoolStill…prior experience rarely prepares our students for the academic and social life of the college experience. For example, in high school: • students’ days were rigidly controlled, • they often had a personal relationship with a teacher which helped to motivate them, • assigned reading was discussed thoroughly in class and students were tested frequently covering short spans of material, • their view of learning was often memorizing a collection of facts and their view of teaching was transmission of knowledge from teacher to student, • and many had strong support systems of family and/or friends to turn to for advice, help or comfort.
When they arrive on campus they often report feeling… • excited about their new adventure • homesick for family and friends • intimidated by “professors” • intimidated and frustrated by bureaucracy on campus • fearful of not doing well academically • fearful of not establishing relationships with peers • uncertain of how to get involved and connected to clubs, organizations, and students groups • concerned about not achieving their goals
Warning Signs for At-Risk Students • Absenteeism from class, especially early in the term • Failure to turn in assignments • No “nesting” behavior—suitcases may still be packed, no pictures on the wall, etc. • Failure to use meal card – dining halls • Returning home every weekend • Lack of involvement on campus • Signs of possible depression
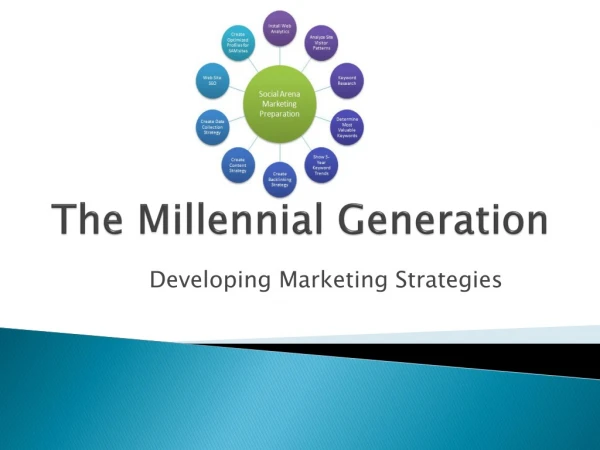
Implications – How Should We Strategically Plan for the Millennial Generation? Colleges and universities have a responsibility to meet students where they are, rather than wish for another kind of students. Institutions must respond to the kinds of students they are dealing with now, be aware of who they are, how they think, and how they feel. Knowing more about the millennial generation is vital if we are going to provide relevant and appropriate student services. Acknowledging that Millennials have grown up on computers and the Internet where services and information are readily available day or night, it is a reasonably safe assumption that they will prefer—if not expect—this service delivery. What does this mean to the services that we provide?
Implications – Strategic Planning for the Millennial Generation • Millennials are close to their parents who with counselors, physicians, lawyers, will form a “helicopter team” hovering over the student through the college years. Parents who once obsessed over their child’s soccer games will play an equally involved role when their children come to campus. Millennials will prefer nearby colleges to their families. • We need to market a safe, protected environment and promote an environment safe from corrupting values and commercialism. Top quality health services and counseling services will be critical to this generation. They will use the latter proactively. • ‘In loco parentis’ will supplant FERPA as the guiding principle. Finding means to engage parents will become critical. Institutions are already responding by creating offices of parental communications to handle the avalanche of e-mail from mom and dad.
Implications – Strategic Planning for the Millennial Generation • Class and gender differences will overtake race as the topic of debate. The line between the halves and the have-nots will be drawn over issues of who can afford college-selection counselors and private tutors. Recruitment and retention services will increasingly be focusing on men, who will be dropping out in record numbers. • Millennials are a generation accustomed to following rules. They have ambitious schedules of homework and extracurricular activities. We should stress good outcomes. Emphasis on social norming and how many people are doing the ‘right thing.’ This generation will respond positively to expectations for success.
Implications – Strategic Planning for the Millennial Generation • Millennials aspire to teamwork in their careers and expect technology to constitute an important dimension of their work. • They are more cognizant of the global dimension of their lives. They great up with diversity. We need to promote our liberal studies curriculum and how this program relates to their lives. • Millennials agree with parental values and expect high standards of behavior. We need to set high standards of expectations within in and out of the classroom experiences.
Implications – Strategic Planning for the Millennial Generation • Millennials want to have constant feedback and know how they are doing all the time. • They also want life balance with an equilibrium between work and play. • Millennials think it’s cool to be smart and they are more likely to be better in science and math than verbal. • They expect our institution to provide cutting-edge technology. How can we use what we know about our students to improve our efforts in helping them to become successful learners?
They’re variously called the Internet Generation, Echo Boomers, the Boomlet, Nexters, Generation Y, the Nintendo Generation, the Digital Generation, and in Canada, the Sunshine Generation. Millennials are arriving on our campus with higher expectations than any generation before them – and they’re so well connected that, if we do not match those expectations, they can tell a few hundreds instant messaging peers with one click of the mouse.
Millennial Learning Preferences • Teamwork • Technology • Structure • Entertainment & excitement • Experiential activities • Flexibility in the learning environment • A learning environment focused on goals • Challenging assignments • Learning new knowledge and skills • Respect for ideas and input