Download
1 / 36
380 likes | 945 Views
Demography of Contemporary Uzbekistan A Presentation by Ross Smeltzer. Geographic Location . Post-Soviet Politics of Uzbekistan.

E N D
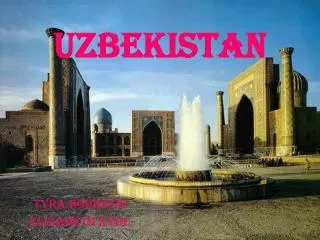
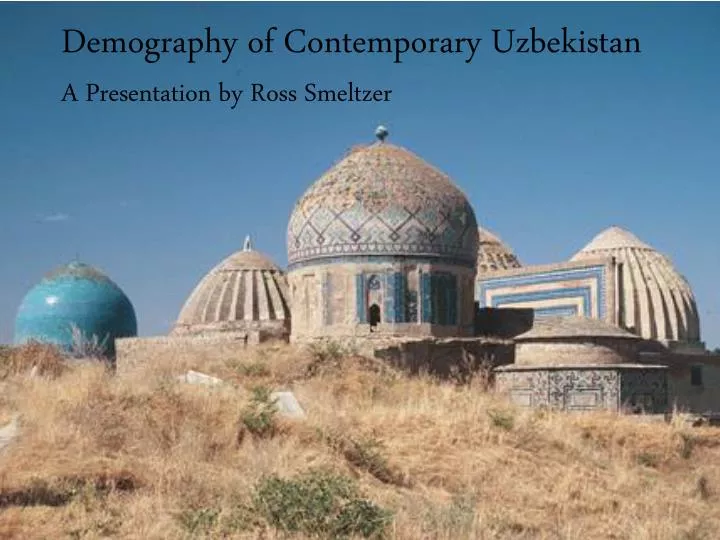
Demography of Contemporary UzbekistanA Presentation by Ross Smeltzer
Post-Soviet Politics of Uzbekistan According to the US Department of State, while, in theory, “The constitution provides for a presidential system with separation of powers between the executive, legislative, and judicial branches. In practice…President Islam Karimov and the centralized executive branch dominate political life and exercise nearly complete control over the other branches…Citizens did not have the right in practice to change their government through peaceful and democratic means.” In 2009, Uzbekistan was classified by Freedom House as one of its “Worst of the Worst” and received the lowest possible ratings in terms of both civil liberties and political rights. “It is the duty of every citizen to defend the republic of Uzbekistan.”
The Post-Soviet Transition in Uzbekistan • President Karimov, a former economist, committed Uzbekistan to a “gradualist” transition to a market economy. • Uzbekistan’s GDP declined during the first years of the economic transition, recovered by 1995 and is now growing. The percentage of the population classified as living below the poverty line also increased during the transition period. • But by 2001 it was the only country in the former Soviet Union to have surpassed its 1989 level of GDP. • Agriculture remains the mainstay of the economy and contributes around a third of its gross domestic product. This is untypical of the former Soviet states, and has resulted in a very “oligarch”-dominated economy.
Economic Transition Continued According to the UN’s Development and Transition agency, Uzbekistan’s recent growth has not been accompanied with a reduction in inequality and poverty. The percentage of Uzbeks who lived in poverty was 44% in 1989 and by 2007 this number had grown to 47%. Poverty in the country is an overwhelmingly rural phenomena, with 55% of the rural population living in poverty compared with 4% in the capital, Tashkent. This has implications for Uzbek emigration behavior.
Uzbekistan’s Population within the Soviet Union • Between 1897 and 1991, the population of the region that is now Uzbekistan more than quintupled, while the population of the entire territory of the former Soviet Union had not quite doubled. • In 1991 the natural rate of population increase (the birth rate minus the death rate) in Uzbekistan was 28.3 per 1,000--more than four times that of the Soviet Union as a whole, and an increase from ten years earlier. • Five of the eight most densely populated provinces of the former Soviet Union--Andijon, Farghona, Tashkent, Namangan, and Khorazm--are located in Uzbekistan • In the last All-Union Census (1989) 71.4% of the Republic’s citizens were ethnic Uzbeks.
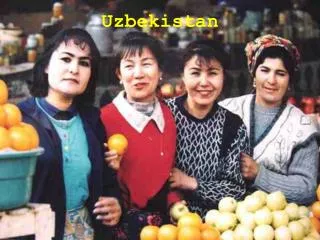
General Population Characteristics • According to estimates, Uzbekistan was expected to have 27,606,007 citizens by 2009 (Researchers must rely on estimates, since the last census of the republic was in 1989. A census is scheduled for 2010, however.) • This makes it the 42nd most populous country in the world and the most populous of the post-Soviet Central Asian republics. Its population comprises nearly half of the total population of Central Asia. • Ethnic Uzbeks now constitute around 80% of the republic’s population, with Russians making up around 6% and Tajiks a further 5%. The rest of the population is composed of small contingents of Tatars, Kazakhs, Armenians, Koreans and Karakalpaks.
Population Structure Uzbekistan is not only a populous country. It is also a relatively youthful one. Age Structure: • 0-14 years: 28.1% (male 3,970,386/female 3,787,371) • 15-64 years: 67% (male 9,191,439/female 9,309,791) • 65 years and over: 4.9% (male 576,191/female 770,829) (2009 est.) Median Age: • total: 24.7 years • male: 24.2 years • female: 25.2 years (2009 est.) Urbanization • urban population: 37% of total population (2008) • rate of urbanization: 1.6% annual rate of change (2005-10 est.)
Russia’s Population Structure in Comparison Age Structure • 0-14 years: 14.8% (male 10,644,833/female 10,095,011) • 15-64 years: 71.5% (male 48,004,040/female 52,142,313) • 65 years and over: 13.7% (male 5,880,877/female 13,274,173) (2009 est.) Median Age • total: 38.4 years • male: 35.2 years • female: 41.6 years (2009 est.)
Uzbekistan’s Population Growth According to USAID, the population growth rate of Uzbekistan was 0.94 in 2009, making it the country with the 134th highest population growth rate, below that of the United States at 130th. Russia’s population growth rate, in contrast, is -0.47.
Population Continued • The UN has projected that by 2025 the Uzbek population could be as high as 34, 203,000 and that by 2050 it could reach 40,513,000. Data taken from the World Bank’s World Development Indicators
Uzbekistan’s Fertility Rate • Though Uzbekistan’s population has been growing steadily since the 1960’s, its fertility rate began stagnating at around the same time. It then began declining to its present rate. • Uzbekistan’s 2009 fertility rate is 1.95 children born/woman (2009 est.) • According to UNICEF, it was 4.07 in 1990 and 2.36 in 2003. • The republic’s crude birth rate is 17.58 births/1,000 population (2009 est.) • In comparison, Russia’s fertility rate is 1.41 children born/woman (2009 est.) and its birth rate is 11.1 births/1,000 population (2009 est.)
The Long Term Decline in Uzbek Fertility Rates This data was taken from Magali Barbieri, Alain Blum’s and Elena Dolknigh’s “Nuptuality, Fertility, Use of Contraception and Family Policies in Uzbekistan.” The authors argue that “the demographic transition is well under way” in Uzbekistan and that it is a product both of Soviet-era modernization and contemporary government policy.
The Uzbek “Demographic Transition” in Regional Perspective
Explanations for Declining Fertility • Barbieri, Blum and Dolkigh argue that Soviet educational modernization, specifically programs targeted towards women (women’s education programs, availability of abortions and the mandatory inclusion of women into the workplace), account for the decline in the fertility rate. Uzbek Literacy • total population: 99.3% • male: 99.6% • female: 99% (2003 est.) Governmental Efforts to lower Fertility • Buckley, Barrett and Asminkin find that the Karimov government has actively campaigned to reduce fertility and has made family-planning a governmental priority • They argue that the “Red Apple Program,” a state-funded program to increase family-planning awareness, pressures women to use IUD’s, at the expense of all other forms of contraception. • One Bukharan woman reported that “when you go to the clinic after the birth, they insist on the IUD. My gynecologist said to me, ‘Lie down; I’ll apply the IUD. You shouldn’t become pregnant for 3 years.’ They put pressure on women.”
Life Expectancy and Mortality in Uzbekistan • Life expectancy at birth for the total population was, in 2009, 71.96 years • For men it was 68.95 years • For women it was 75.15 years
Top Ten Causes of Death in Uzbekistan • Ischaemic heart disease – 33% • Cerebrovascular diseases – 14% • Lower respiratory infections – 6% • Hypertensive heart disease – 5% • Cirrhosis of the liver – 4% • Perinatal conditions – 3% • Inflammatory heart diseases – 3% • Tuberculosis – 3% • Chronic obtrusive pulmonary disease – 2% • Diabetes mellitus – 2% • The WHO in Uzbekistan estimates that “The leading broad-group causes of death are cardiovascular diseases (57.87%), respiratory disease (8.38%), cancer (7.24%), external causes (injuries and poisoning) (7.21%), diseases of the digestive system (6.43%) and infectious and parasitic diseases (2.88%). • Most of the widespread health problems are related to poor nutrition, environments and food and water safety, and low physical activity.” Data taken from the “Death and DALY” estimates by cause, 2002
Mortality Rates Continued • The Death Rate of Uzbekistan in 2009 was 5.29 (deaths/ 1000 persons). In 2003 it was 7.97 and in 2007 it was 7.73. In 2009 Russia’s was 16.2 and Ukraine’s was 16.4. • The Under-5 mortality rate in 1990 was 74 (per 1000 births) • This declined to 38 in 2008 • The infant mortality rate (under 1) was 61 in 1990 • It was 34 in 2008
Demographic Transition Model • Model designed to represent the transition from pre-industrial to modern society. • Most developing countries fall within the second or third stages of the model • Uzbekistan’s declining Death Rate and Birth Rate (with the predicted declining Fertility Rate) means that it is within these transition stages.
Migration • Konstantin Romodovsky, the head of Russia’s migration service, said that Uzbekistan is the third-largest source of migrant labor for Russia. • In 2006, a total of 500,000 Uzbek migrants travelled to Russia for work. • Most are, according to the United Nations’ Development Program for Uzbekistan, forced to work abroad because of a lack of opportunity in Uzbekistan. • Uzbekistan’s Net Migration Rate is -2.94 migrant(s)/1,000 population (2009 est.) • At least 10% of Uzbekistan’s labor force works abroad, mostly in Russia and Kazakhstan. • Most Uzbek labor migrants remain abroad for between 3-10 years.
Migration Continued • 33% of external labor migrants have higher education • 31% have secondary education • 26.2% have specialized post-secondary education • Migrants can earn $300-$400 a month in Russia. They would typically earn 145,000 sums ($115) a month in Uzbekistan. • One female interviewee said that “What work can you find in the village? All you can do is work in the field all year. My husband tried to earn more, and went to work in the field when he had a temperature, and when it was raining. He earned peanuts - not enough for anything...” • On average, individual migrants send 90,000 sums home from abroad. • Migrant remittances represent around 7% of Uzbekistan’s GDP, much lower than Armenia’s, Tajikstan’s or Moldova’s.
Bibliography • Agadjanian, Victor and Makarova, Ekaterina. “From Soviet Modernization to Post-Soviet Transformation: Understanding Marriage and Fertility Dynamics in Uzbekistan.” Development and Change. 34(3): 447-473 (2003). • Barbieri, Magali, Blum, Alain, Dolknigh, Elena. “Nuptiality, Fertility, Use of Contraception, and Family Policies in Uzbekistan.” Population Studies. Vol. 50, No. 1 (March, 1996) pp. 69-88. • “Buckley, Cynthia, Barrett, Jennifer and Asminkin, Yakov P., “Reproductive and Sexual Health Among Young Adults in Uzbekistan.” Studies in Family Planning. (35)1: 1-14 (2004). • CIA – The World Factbook • UNDP’s Human Development Report 2009 • United Nations’ Department of Economic and Social Affairs/ Population Division – Country Profile, Uzbekistan • U.S. Census Bureau’s International Database • Uzbekistan in Figures – Joint Analysis by the UNDP Country Office and the Center for Economic Research in Tashkent, Uzbekistan • World Bank’s Data Finder – Country Profile, Uzbekistan • The World Bank – Country Brief 2010, Uzbekistan • World Health Organization – Country Profile, Uzbekistan