Download
1 / 3
0 likes | 1 Views
Au00a0Power BI courseu00a0is the ideal way to gain hands-on skills in data visualization and business intelligence. Whether you're a beginner or looking to enhance your analytics expertise, this course teaches you how to create interactive dashboards, connect data sources, and generate real-time insights. With user-friendly tools and drag-and-drop features, Power BI simplifies data analysis for professionals across industries. The course covers essential topics like DAX functions, Power Quer.

E N D
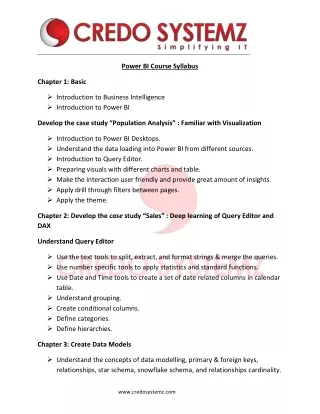
What to Expect from a Power BI Course for Analysts A lot of analysts still lean on Excel to crunch numbers and share reports, even though better tools are out there. Power BI has quietly moved from being “nice to know” to “essential” in many teams. If you're spending too much time fixing spreadsheets or manually updating charts, it's probably time to rethink your toolkit. This blog lays out what a Power BI course usually covers, how it fits into your daily work, and what kind of learning experience you can expect as an analyst trying to get better at data. The Analyst’s Role Is Shifting Analysts used to focus mostly on collecting and formatting data. Now, more teams expect you to interpret results, spot patterns early, and tell clear stories with your dashboards. You're not just the person who knows where the data lives, you’re often the one who helps others understand what’s going on. To keep up, you need tools that work with you but not against you. Power BI gives you that edge, but it only works well if you know how to use it beyond surface-level features. That’s where training comes in. What You Actually Learn in a Power BI Course A good Power BI courseisn’t just a tour of buttons and menus. It’s built to help you solve the kind of problems you run into every week. You'll usually start by learning how to bring data in from different sources, Excel files, databases, cloud services, and then clean it up using Power Query. You’ll also get familiar with DAX, which helps you build custom metrics, like year-to-date totals or comparisons across months. Once that’s in place, the focus shifts to visuals, such as how to build dashboards that speak clearly and help others act on what they see. Finally, you’ll learn how to share your reports through the Power BI service so others can view updates in real-time without sending dozens of emails or attachments. Expect a Lot of Hands-On Work That Feels Real
One of the best parts of training is that it’s not just theory. You're not sitting through long lectures on abstract concepts. The better courses drop you into realistic situations like building a sales dashboard or figuring out where expenses spiked last quarter. You’ll practice working with data that behaves like what you see at work: messy columns, missing values, and inconsistent formats. You’ll learn not just what to click but why it matters. That kind of learning sticks because it mirrors how things go in the real world. After a few sessions, you’ll notice how much faster and cleaner your reports become. That’s a clear sign that the training is working. Training Also Solves Problems You Might Not Realize You Have If you’ve ever stared at a formula error or struggled to make a chart show the right comparison, you’re not alone. Power BI can feel a bit much at first, especially the DAX formulas or data model relationships. Good training helps you through that. It breaks things down step by step, often with cheat sheets or examples you can keep using long after the course ends. You’ll also hear practical advice from instructors who’ve worked with messy real-life data, not just demo files. That guidance helps you skip the guesswork and avoid the common mistakes that slow people down when they’re learning alone. Why Learning Power BI Makes Analysts More Effective It’s not just about knowing how to use the tool. After training, you’ll be able to answer questions faster, build reports that update on their own, and spend less time formatting and more time thinking. You’ll also gain a better sense of how to show trends, outliers, and comparisons in ways people actually understand. That makes your insights more likely to drive action, not just sit in someone’s inbox. And when people across your team start relying on your dashboards to make decisions, your role becomes a lot more visible. It’s a smart way to stand out without needing to shout. Picking the Right Course Makes a Big Difference
Not all training is created equal. Some courses are beginner-friendly, while others assume you’ve already played around with the tool. Think about where you are now and pick something that builds from there. You might prefer a live session where you can ask questions on the spot, or maybe you want the flexibility to go at your own pace. Either way, look for a course that includes projects, not just video tutorials. Check if they give you access to templates, practice files, or a way to get feedback. If possible, preview a lesson or two before signing up. That’s the easiest way to know if the teaching style works for you. Conclusion A well-built Power BI course does more than teach functions, it helps you think more clearly with data. You’ll finish with sharper skills, smoother workflows, and a stronger sense of what good reporting looks like. As more companies rely on smart reporting to guide strategy, the analysts who grow their skills now will shape how those decisions are made. The tools will keep evolving, but the value of knowing how to ask the right questions and build reports that answer them won’t go out of style anytime soon. Source Link: https://dreamingspiritual.com/what-to-expect-from-a-power-bi-course-for-analysts/