Goals
Preschool For All Supply and Demand Study 4Cs of San Mateo County in collaboration with California Child Care Resource and Referral Network Center for the Study of Child Care Employment UC Berkeley Survey Research Center. Goals. Inform PFA planning with primary parent data

Goals
E N D
Presentation Transcript
Preschool For AllSupply and Demand Study4Cs of San Mateo Countyin collaboration withCalifornia Child Care Resource and Referral Network Center for the Study of Child Care EmploymentUC Berkeley Survey Research Center
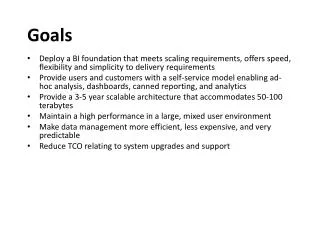
Goals • Inform PFA planning with primary parent data • Implement a comprehensive census of existing preschool supply • Quantify preschool gaps at the community level, with reference to targeted (vs. licensed) capacity, types and hours of care, affordability, language/ethnicity and quality • Assess the PFA readiness of the child care workforce and child care facilities • Recommend priorities and strategies for incremental deployment of PFA
Methodology • Random digit dialing parent interviews conducted by Field Research Corp. in English and Spanish (600 completed). • Written surveys of centers (72% completion rate) and licensed homes (60% completion rate). • Nine parent focus groups and four provider focus groups to explore and document values and preferences.
Team Roles and Responsibilities • 4Cs • CA Child Care Resource and Referral Network • Center for the Study of the Child Care Workforce • Field Research Corp. • UC Berkeley Survey Research Center
Myth Busters • Parent Site Preferences Myth: Parents do not want to place young children under five on elementary campuses with older children Fact: More than half of the parents surveyed chose preschool classrooms at elementary schools as the preferred location. • Spanish-speaking Parent Preferences Myth: Spanish-speaking parents prefer informal, family caregiving to formal preschool for young children Fact: Spanish-speaking parents support Preschool for All in even higher numbers than English-speaking parents
Myth Busters (cont’d) • Pre-school Supply Myth: We do not have a shortage of preschool spaces in San Mateo County Fact: When estimates of preschool classroom spaces are adjusted only to serve three and four year old enrollment and only to reflect the desired enrollment of the provider (rather than maximum licensed capacity), shortages of licensed preschool programs are an issue in our county (in some communities more so than others) • Child Care Provider Attitudes towards Preschool for All Myth: The existing provider community is opposed to Preschool for All because it upsets the status quo and threatens their independence. Fact: Many providers support Preschool for All when it is framed as a strategy to improve the quality of existing preschools and make preschool affordable and accessible for all o
Provider Survey Overview • Written surveys sent to all licensed child care centers and family child care homes in the R&R database • Spanish and English versions were available for family child care providers • Target Response Rate -- 60% for centers and 40% for family child care homes • Actual Response Rate -- 72% for centers (n=233) and 60% for family child care homes (n=352)
Survey Topics and Questions • Comprehensive • 83 questions for Centers and 64 questions for FCCHs • Four Sections: • Program Overview-- Regulation Status, Licensed Capacity, Target Enrollment, Vacancies/Waitlists • Facilities--Interests in Expansion, Needs, and Challenges • Workforce-- Educational, Ethnic, and Linguistic Background by Position • PFA Interest—Support and Challenges Needed to Support PFA standards
PFA Supply and Demand StudyChild Care CentersSample BackgroundFacilities and Expansion InterestsPFA InterestsWorkforce
Respondent BackgroundCities Represented 60 50 40 # of existing ctrs 30 # of ctrs represented in the study 20 10 0 Millbrae Belmont Pacifica Daly City Atherton La Honda Menlo Park Woodside San Mateo Foster City Burlingame San Bruno San Carlos Hillsborough East Palo Alto Portola Valley Redwood City El Granada/Half Moon Bay S San Francisco/Brisbane
Respondent BackgroundLength of Operation 0-5yrs 19% +30yrs 18% 5-15yrs 27% 15-30yrs 37%
Respondent BackgroundLicensing and Accreditation • 30% Title 5, 52% Title 22, 18% Exempt • 58% of respondents indicate being licensed for P/S NAEYC Accredited 11% H/S 35% Title 5 65% n=66 n=116 89% Contracted Non-contracted (13 + 66=79 out of 223 are eligible to be PFA sites, or 35% of our sample)
Child Care SupplyVacancies in Title 5/HS vs Title 22 Centers • More S/A & I/T programs indicated having vacancies • Approx 54 % of P/S programs indicated vacancies 6% 12% 24% 29% 69% 59% 264 spaces in 116 ctrs 246 spaces in 133 ctrs Title 5 /HS 3 year olds 4 year olds Title 22 Exempt
Child Care SupplyLocation of Centers with Vacancies Out of 117 respondents: • 69% Slow Economy (n=81) • 47% Families Cannot Afford (n=55) • 41% Other (n=48) • 9% Program Location (n=10)
Child Care SupplyWaitlists in Title 5/HS vs Title 22 Centers • Approx one-third of all centers indicated having waitlists 11% 8% 40% 39% 52% 50% 1274 spaces in 149 ctrs 553 spaces in 128 ctrs Title 5/HS 4 year olds 3 year olds Title 22 Exempt
Average Monthly Fee • $764.49 full-day care, ranging from $ 573.89 in SSF to $1700 in Atherton • $538.26 part-day care, ranging from $338.91 in SSF to $1611 in Atherton • 31 % of children enrolled at centers with preschool age children receive fee assistance of some sort
Types of Fee Assistance Other 5% Sliding Fee Scale 9% Program Scholarship 21% Public Subsidy 65% n=1783
FacilitiesTop Four Areas for Facilities Improvement • What facility changes would you like to make to improve the quality of your existing program? 50% 40% 39% 39% 38% 37% 30% None 38% 20% 10% 0% Repair/ Upgrade Purchase Sig Indoor Equip Purchase Sig Outdoor Equip Improve Interior/Ext Security Yes, 62%
70% 60% 50% 40% 30% 20% 10% 0% Lack of funding /capital Uncertain enrollment/demand Lack of org capacity or time Landlord/tenant issues Other FacilityExpansion Interests • 40%(P/S) are interested in expansion What has prevented you from expansion? 70% 60% 50% 40% Top facility/site improvements needed to support expansion of your program 30% 20% 10% 0% expand outdoor space remodel existing program provide additional toilets and sinks add new permanent or modular space
PFA Interest Centers interested in PFA MD 8% Very interested 28% Not at all 25% Somewhat interested 39%
PFA Interest by Vacancy Status Center Interest in PFA by Vacancy Status 100% 28% 26% 80% 60% Not at all 46% 36% Somewhat 40% Very 20% 26% 37% 0% Centers with vacancies Centers with no vacancy
PFA InterestTop Reasons for Interest 70% 66% 60% 57% 50% 40% 40% 30% 34% 20% 15% 10% 0% To expand number of licensed preschool spaces in my community To increase/ stabilize enrollment in our existing preschool program To improve the quality of our program To make our preschool more affordable for the families we serve Other
PFA InterestTop PFA Challenges Indicated by Centers • Salaries for classroom teachers that established parity with local K-12 system • Competitive benefit package for classroom teachers • Staffing qualifications and professional development (by 2010, lead teacher in each classroom with a BA/BS degree, Master Teacher Permit, pass CBEST)
PFA InterestSupport Most Needed for Staff • Courses offered in community-based settings, e.g. local centers • Courses offered to group of, or entire staff, of a center • Pool of substitutes available to allow for attendance at day classes • Language support, such as bilingual courses or translation of lectures or reading materials
PFA InterestSupport Most Needed If you are not currently a Title 5, H/S, or NAEYC accredited center, what assistance would you need? 80% 70% 71% 60% 50% 48% 40% 44% 30% 20% 22% 10% 0% Funding to enable staff Funding to address Training and technical Other to participate in NAEYC gaps identified during assistance in NAEYC accreditation process NAEYC accreditation standards and process accreditation process
WorkforceEducation of Teachers • P/S staff: • 21% assistants hold AA degrees or higher • 39% teachers hold BA degrees or higher • 61% directors BA +
WorkforceTeacher Education Title 5 High school or less 2% BA/BS or higher Some college 36% 41% Title 22 High school or less 0% AA/AS BA/BS or higher 21% Some college 42% 40% AA/AS 18%
WorkforceEthnicity by Position Teacher Assistant Teacher 5% 5% 2% 5% 8% 46% 13% 55% Children in SMC (0-12) 22% 39% 7% 8% 36% Caucasian 19% Hispanic Asian/ Pacific Islander African American Other 30%
WorkforceLinguistic Background • 56% of teaching staff speak English only (37% hold BA+) • 34% of teaching staff are fluent in English and another language (27% hold BA+) • 3% of teaching staff speak a language other than English fluently but are not fluent in English (11% hold BA+)
WorkforceHighest and Lowest Wages of Teachers $30.00 $25.00 $21.56 $20.00 $18.64 $17.13 $15.00 $15.04 $10.00 Some College BA or higher
Respondent BackgroundCities Represented 120 100 80 # of existing FCCs 60 # of FCCs represented in the study 40 20 0 Pacifica San Bruno San Mateo E Palo Alto Foster City Redwood City Colma/Daly City So. San Francisco/ Brisbane Burlingame/Millbrae/ Hillsborough Belmont/San Carlos Menlo Park/Woodside El Granda/Half Moon Bay/ Montara/Moss/La Honda
Respondent BackgroundType of FCC Home • Average # of years in business= 9.9 • Only 20% serve children with special needs • 73% of families served are neighborhood residents Large 36% Small 64% n = 351 cases
Respondent BackgroundEducation BA/BS degree or higher HS or less 21% 25% AA/AS degree Some college 11% 43%
Respondent BackgroundEthnicity African American Other 9% 11% Asian 5% Filipino 9% Hispanic 29% Caucasian 37%
Respondent BackgroundEthnicity -- Key Facts • Although Caucasians represent only 37% of the workforce, they are significantly over-represented in certain cities: • Belmont/San Carlos 70% • Pacifica 55% • Menlo Park/Woodside 54% • Redwood City 51% • Overall, Hispanic representation does not vary significantly across cities • They represent between 10% (Belmont/SC) to 43% (SSF) or the workforce
Are you familiar with NAFCC (National Association of Family Child Care) accreditation? Yes 38% Yes 10% No 62% No 90% Respondent BackgroundAccreditation Status Are you currently accredited by NAFCC? n = 317 cases n = 117 cases
Avg Weekly Fee & Fee Assistance Average Wkly Fee: • 3-year-olds $130/week N=256 • 4-year-olds $125/week N=247 Fee Assistance: • 20% of children receive fee subsidy • 10% of children receive rate reduction • 5% of children receive “other” type of fee assistance
1400 1200 1000 800 600 400 200 0 <3 yr olds 3 yr olds 4 yr olds 5 to <12 yr 12+ yr olds olds Respondent BackgroundCurrent Enrollment
No 33% Yes 67% Respondent BackgroundVacancy Status Top reasons for vacancy: • 63% slow economy • 33% families cannot afford schedule • 25% prefer working with a smaller group • 24% too much competition /saturated market (Vacancy Status does not vary significantly across regions)
Respondent BackgroundVacancy Status Cities with highest % of FCC Homes reporting vacancies are: • East Palo Alto 84% • Redwood City 75% • South San Francisco 74% Providers in Moss Beach, Montara, El Granada, and HMB are more likely to report “program location” as the primary reason for vacancy No statistical significance exists between the size of home (whether it’s large or small) and vacancy status
FacilityExpansion Interest Are you interested in expanding to a large center? • 38% yes • 51% not interested • 11% expansion not possible • (Interest does not vary significantly across regions) When asked why they are not pursuing expansion at this time: • 76% enjoy smaller # of children • 62% not interested • 33% environment is satisfactory • 16% lack of funds
FacilityTop Areas for Improvement • 58%--purchase significant outdoor equipment • 41%--purchase significant indoor equipment • 34%--improve interior and exterior security Top 3 Areas for Improvement: Not interested 49% Interested in improv 51%
PFA Interest • Top reasons for interest: • 77% to improve quality of my FCC program • 50% to make my p/s more affordable • 39% to expand spaces • 38% to stabilize my enrollment Very Not at all 33% 29% Somewhat 38% Large homes are more likely to be “very interested” in PFA than small homes
PFA Interest by Region • Cities with strongest interest in PFA: • El Granada/Half Moon Bay 44% • Menlo Park/Woodside 54% • San Mateo 39% • East Palo Alto 39%
PFA InterestTop 3 Challenges for FCC Homes • Salary parity for teachers with K-12 workforce (59%) • Staffing qualifications and development (49%) • Accessible environment for children with special needs (39%)
PFA InterestSupport Most Needed for Staff Courses offered in community-based settings 75% Online or weekend courses 73% Financial Assistance w/ books 70% Financial Assistance w/ tuition 69% 0% 20% 40% 60% 80% 100%