Download

1 / 20
200 likes | 368 Views
The Effects of Health Plan Performance Measurement on Quality of Care for Medicare Beneficiaries. Presented by Kate Bundorf Co-authors: Laurence Baker and Kavita Choudhry. AcademyHealth Annual Research Conference June 27, 2006.

E N D
The Effects of Health Plan Performance Measurement on Quality of Care for Medicare Beneficiaries Presented by Kate Bundorf Co-authors: Laurence Baker and Kavita Choudhry AcademyHealth Annual Research Conference June 27, 2006 This project received support from the National Institute on Aging (AG023557 ) and the Agency for Healthcare Research and Quality (KO2 HS11668).
Background • Health care provider “report cards” are viewed as a tool to improve quality of care. • Allow consumers to make tradeoffs between cost and quality when choosing among providers. • Create incentives for providers to improve quality of care. • Medicare has been at the forefront of efforts to disseminate information about provider quality. • NCQA has been the key driver of initiatives to measure health plan quality. • The Medicare program began requiring Medicare managed care plans to submit Medicare HEDIS data as of January 1997
Have Health Plan Report Cards Improved Quality of Care? • Do consumers use the information? • Health plan report cards have had a small effect on health plan enrollment in the commercial population (Chernew, et. al. 2001; Beaulieu, 2002; Scanlon et. al, 2002; Wedig and Tai-Seale, 2002; Jin and Sorenson, 2005). • Health plan report cards in the Medicare program have shifted enrollment from lower to higher quality plans; but • Enrollment shifts have been driven by measures of consumer satisfaction rather than measures of processes of care (Dafny and Dranove 2006). • Do providers use the information? • Hospitals responded to the implementation of mandatory report cards even in the absence of evidence that patients were using the information (Dranove, Kessler, et. al. 2003). • HEDIS performance indicators are widely used by health plans to implement and monitor quality improvement programs (Perry 2000; Scanlon, Darby, et. al. 2001).
Have Health Plan Report Cards Improved Quality of Care? • Performance on the indicators among plans participating in HEDIS has improved over time (NCQA 2002; Lied and Sheingold 2001; Trivedi, Zaslavsky, et. al. 2005). • These trends are not necessarily evidence of a causal effect: • No control group • Improvements in performance could be driven by improvements in measurement • Changes in utilization could be due to changing plan enrollment • After controlling for these issues in the commercial population, performance improvements are less dramatic (Bundorf and Baker 2006).
Study Design • Compare utilization of measured services between Medicare managed care enrollees and other beneficiaries before and after the implementation of mandatory quality reporting. • Use managed care market share in the beneficiaries’ county to control for both selection of beneficiaries across sectors and spillovers from managed care to the FFS sector.
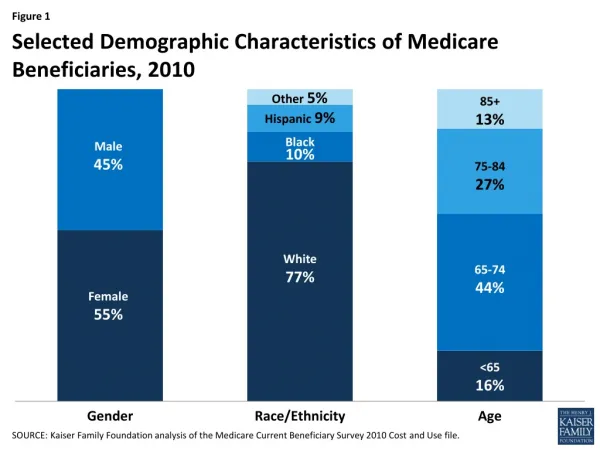
Data Sources • 1993-1999 Medicare Current Beneficiary Survey (MCBS) • Annual survey of approximately 12,000 Medicare beneficiaries conducted by CMS. • Study sample includes non-institutionalized beneficiaries >=65 residing in a metropolitan area. • 1993-1999 Medicare Managed Care Market Penetration Report from CMS.
Utilization of performance indicators among Medicare managed care enrollees
Utilization of performance indicators relative to other beneficiaries
Model Estimation Model 1: Unadjusted difference-in-difference estimate Compare the difference between beneficiaries enrolled in managed care plans and those enrolled in FFS before and after the implementation of mandatory quality reporting for Medicare managed care plans (controlling for time trends common to all beneficiaries). Model 2: Control for selection based on observable characteristics Controls include age, sex, education, marital status, race, ethnicity, self-reported history of 16 conditions, self reported health status, number of ADLs, BMI indicators, smoking status, and county fixed effects. Model 3: Control for selection and spillover effects using managed care market share variables • Spillover and selection effects: managed care share • Selection effects: managed care share*HMO enrollee • Difference between pre- and post-intervention periods in spillover and selection effects: Interaction of each variable with an indicator of the intervention period
Summary of Results • Rates of utilization of the performance indicators we studied did not increase more rapidly among Medicare HMO enrollees than beneficiaries enrolled in traditional Medicare subsequent to the implementation of mandatory quality reporting. • The lack of a positive effect of quality reporting on utilization of performance measures among HMO enrollees is not sensitive to controlling for either selection of enrollees across the sectors or spillovers from quality reporting activities to the FFS sector. • Utilization rates of beta blockers increased more rapidly for FFS beneficiaries in markets with high levels of managed care penetration in the post-reporting period.
Implications • The implementation of mandatory health plan quality measurement and reporting did not increase utilization of performance measures among Medicare managed care enrollees for the services we studied. • Report cards did not create strong enough incentives for plans to improve their performance. • Quality improvement programs were in place in HMOs serving the commercial population prior to the implementation of mandatory participation by the Medicare program. • Indicators we studied are not those that were likely to have shown improvement. • Quality reporting by HMOs may have had positive spillover effects on the Medicare FFS population.
Research Question • Did the implementation of mandatory health plan participation in standardized performance measurement and reporting improve quality of care among enrollees in Medicare Managed Care plans?
Health Plan Performance Measurement in Medicare • In 1996, HCFA contracted with NCQA to develop HEDIS measures for Medicare managed care plans. • HCFA began requiring plans to submit Medicare HEDIS data as of January 1997. • In 1998, CMS launched www.Medicare.gov. • In 1999, HEDIS measures became available on the site.
Model Estimation Model 1: Unadjusted difference-in-difference estimate where i indexes individuals, m indexes counties, t indexes years (1993-1999) Y is a binary indicator of utilization of service; H is an indicator of enrollment in a Medicare managed care plan; I is an indicator of whether mandatory quality reporting had been implemented during the time period; and Z includes year fixed effects Model 2: Control for selection based on observable characteristics Controls include individuals characteristics (age, sex, education, marital status, race, ethnicity, self-reported history of 16 conditions, self reported health status, number of ADLs, BMI indicators, and smoking status) and county fixed effects. Model 3: Control for selection and spillover effects using market share variables