Download
1 / 3
30 likes | 103 Views
Today, Geo data visualization has tremendously revolutionized the area of environmental analysis & conservation.

E N D
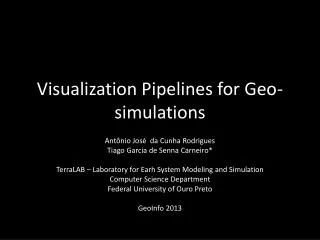
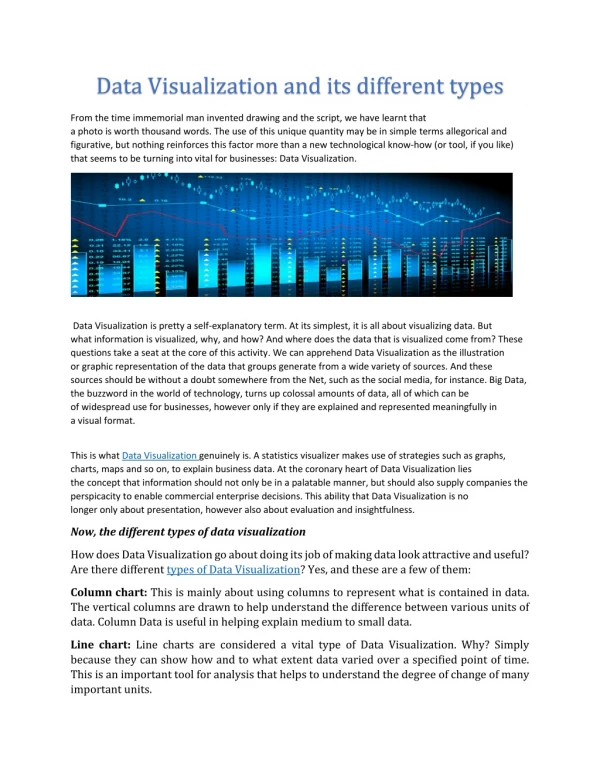
Different Applications of Geo Data Visualization Today, Geo data visualization has tremendously revolutionized the area of environmental analysis & conservation. It has been delivering some powerful tools for understanding & addressing certain complicated environmental challenges. By the help of effectively utilizing the capabilities of geo data visualization, researchers, as well as conservationists, can analyse & visualize spatial data in an innovative manner, mainly coupled with 3D controllers. This thing is generating more and more strategies for effective environmental management. So, if you want to know the benefit of Geo Data Visualization in the form of Conversation effects & environmental analysis then this sort of guide will help you to understand each and everything: What Exactly Interactive Mapping Can Do For Understanding Ecosystems? • Interactive mapping is making use of Geo data visualization to allow quality researchers to analyse as well as explore intricate relationships within the ecosystems. • By overlaying different layers of spatial data, such as land cover, vegetation density, and biodiversity hotspots, scientists can identify patterns and correlations crucial for effective conservation planning. • 3D controllers enable users to manipulate and navigate through the visualized data, gaining a comprehensive understanding of the ecosystem's structure and dynamics. • 3D stereoscopic monitors add depth and realism to the visualizations, enhancing the interpretation and perception of complex spatial information. Tracking & Monitoring Wildlife Populations • The Technique of Geo data visualization is delivering needful assistance in terms of tracking as well as monitoring wildlife populations which is important for the conservation of wildlife.
• Through integrating information right from the GPS-enabled satellite imagery, and collars, researchers are now able to visualize multiple animal movement patterns, habitat preferences, and migration routes. • Many Researchers are also making use of3D controllers for interacting with real- time information, thus allowing researchers to zoom in on specific areas. • For a more immersive experience,3D stereoscopic monitors are delivering deeper insights into animal behaviour with threat identification to their habitats. Useful Assessment of Environmental Impact & Risk Analysis • Geo data visualization proves to be promising in terms of assessment of environmental impact for conducting risk analysis in different industries. • Through better integration of geospatial data, like terrain-elevation, sensitive ecosystems, and water bodies, stakeholders are evaluating informed decisions and environmental consequences. • 3D controller can perfectly be manipulating as well as interact with visualized information. This mainly enables them to assess the overall impact of proposed projects, simulate scenarios, and at last identify mitigation measures. • For the perfect enhancement of visualization of complicated spatial data, this technology has been enabling stakeholders to gain access to environmental risks with sustainable choices. Public Education and Engagement • The idea of Geo data visualization can play a significant role in public education & engagement, thus promoting sustainable practices, and raising awareness in relation to environmental problems. • For the creation of immersive experience, and interactive visualization 3D Controllers are allowing users to understand and explore complicated environmental concepts effectively.
• With the incorporation of real-time information and related elements, like videos or infographics, Geo data visualization is providing tremendous facilitates to knowledge transfer as well as encourages public participation in an effective manner. • For the further enhancement of visual impacts of educational data, and to captivate audiences for inspiring action towards the environmental stewardship, 3D controllers has been impressive. The Bottom Line The Technology associated with Geo data visualization, in conjunction with 3D stereoscopic monitors, as well as 3D controllers, tremendously offers some important tools for environmental analysis & conservation efforts. Their skills to visualize as well as interact with spatial information in an innovative manner allow a lot of researchers, stakeholders, and conservationists to perfectly gain deeper insights. Apart from that, it is helpful in driving effective environmental management tactics and making informed decisions without any worries. Right from understanding ecosystems to the task of monitoring wildlife populations & assessing environmental risks, the range of applications is associated with geo data visualization. This is gaining valuable insights in terms of environmental analysis & conservation for the impactful and vast expertise. By harnessing these technologies, one can work towards a more sustainable and harmonious coexistence with the natural world. Source Link: https://vocal.media/journal/different-applications-of-geo-data- visualization-in-environmental-analysis