Download
1 / 22
230 likes | 441 Views
Applications of Spatial Data Mining & Visualization - Case Studies. Introduction. Meteorological Data and Demographics Data hold important information that can help in several application contexts Several data mining applications possible on these data sets

E N D
Applications of Spatial Data Mining & Visualization - Case Studies
Introduction • Meteorological Data and Demographics Data hold important information that can help in several application contexts • Several data mining applications possible on these data sets • In the department we have research projects working on these data • RoadSafe – Summarizing large spatio-temporal weather prediction data • Atlas.txt – Summarizing UK 2001 Census data • Both these projects present summaries to users in natural language, English and other modes • Real World applications contain data mining as one of the modules or tasks in the project • Not as the end product in itself
Road Ice Forecasts -RoadSafe • Road Ice Forecasts: • Are required by local councils for winter road maintenance operations • Are driven by computer simulation models that predict weather conditions for 1000’s of points on a road network • Output of model is a huge spatio-temporal data set (up to 33mb for some councils) • Form part of a road forecasting service delivered to Road Engineers via an online Road Weather Information System (RWIS) • RWIS allows model data to be communicated in various modalities, e.g. text, tables, graphs and maps
Model output is a large spatio-temporal data set (in order of Megabytes) • Road network split into routes, 9 meteorological parameters (e.g. Road • Surface Temperature) measured at each point on a route • Sampled at 20 minute intervals over a 24hr period
Problem • Input: Spatio-temporal weather prediction data (shown on slide 4) • Output: Summary of input data (shown on slide 6) • Task:? • There is no well defined data mining task (classification or clustering or a new task) • Clusters of similar weather spatially and temporally can be one kind of summary • Classification of routes can be another kind of summary • Both used in the final system • Challenges • Complex spatio-temporal data set • Spatio-temporal analysis methods are still maturing • Even visualization of the entire data is hard
Overview of Data Analysis • Two main challenges: • Analysing the input data along the temporal dimension • Analysing the input data along the spatial dimension • Ideally analysis should be performed on both dimensions simultaneously • Solution inspired by Video Processing • The input data set is seen as a video containing 3*24*9=648 frames (maps) • 3 key elements: 0. Pre-processing – geo-characterization – merging required data with other relevant themes • Low level processing • Global Trends – Temporal segmentation • Local Events – Spatial Segmentation (Classification and Clustering) • Event detection and indexing • Keyframe extraction. • Extracted keyframes form the summary
Preprocessing • Geographic Characterisation assigns properties to each data point based on frames of reference for the region • Frames of reference used for spatial clustering
Spatial Reference Frames • Spatial descriptions should be meteorologically correct (not necessarily most geographically accurate) • Forecasters consider how geography influences weather conditions in their descriptions (meteorological inferences) "exposed locations may have gales at times” • Dominant geographical features within regions also affect the reference strategy Kirklees (land locked) Hampshire • Altitude 1. Coastal Proximity • Direction 2. Altitude • Population 3. Direction 4. Population
Spatial Segmentation • Each of the 648 frames (maps) are analysed to compute spatial segmentations (clusters) • Because weather parameters are continuous, they are first discretized • E.g for road surface temperature (map shown on the next slide) • OK => {>4} • Marginal => {<=4 & >1} • Critical => {<=1 & >0} • Subzero => {<=0} • Density based clustering used for performing spatial segmentation
Cluster Densities Frame of Reference Proportion of subzero points 07:20 0740 08:00 08:20 08:40 Altitude 0m: 0.0 0.0 0.0 0.0 0.0 100m: 0.0 0.0 0.0 0.0 0.0 200m: 0.0 0.0 0.0 0.0 0.0 300m: 0.0 0.0 0.0 0.0 0.0 400m: 0.041 0.041 0.12 0.125 0.166 500m: 0.5 1.0 1.0 1.0 1.0 Direction Central: 0.0 0.0 0.0 0.0 0.0 Northeast: 0.0 0.0 0.0 0.0 0.0 Northwest: 0.0 0.0 0.0 0.0 0.0 Southeast: 0.0 0.0 0.0 0.0 0.0 Southwest: 0.014 0.021 0.035 0.0354 0.042 Urban/Rural Rural: 0.002 0.003 0.005 0.006 0.007 Urban: 0.0 0.0 0.0 0.0 0.0
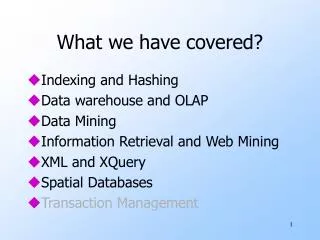
Atlas.txt • Is an ongoing research project • Produces textual summaries of geo-referenced statistics • for visually impaired users • The focus of the project is more on visualization of spatial data by visually impaired (VI) users • Spatial data is essentially geometric and it is not clear how visually impaired users model geometric information • In the absence of vision , is it possible to model geometric information based on tactile and audio inputs? • If possible, what is the nature of these mental models of geometries
Input <2.2 <3.5 <4.8 <6.1 %Unemployment in Aberdeen
Output • No gold standard models of spatial information suitable to VI users available • So several alternative summaries of spatial information that need to be tested on real users • One possible example textual summary: “Some wards in the east and central parts (3,5,6,9) of the city have high percentage of unemployed people aged 16-74 above 03.51%” • Are the textual summaries adequate on their own? • Do they need to be supplemented by tactile or sonic maps? • Tactile maps http://homepages.phonecoop.coop/vamos/work/intact/ • Sonic Maps http://www.cs.umd.edu/hcil/audiomap/
Problem • Input: 2001 UK census data • Output: Summary of input data • Task: Spatial segmentation + Spatial visualization for VI users • Unlike RoadSafe the data mining task is well defined • What is less defined though is the task of visualization of summary by VI users • Shape (geometry) and topology of segments need to be accessible to visually impaired users
Space and Visual Impairment • Atlas.txt is an ongoing research project • more open questions than useful answers • VI users need to perform two tasks for modeling spatial data • Scanning space for information • Several scanning strategies possible • E.g. Left-right VS top down • Coding spatial information using a suitable reference frame • Once again several coding strategies available • E.g. body (ego) centric VS external • VI users are trapped in a vicious circle while finding efficient scanning and coding strategies
Strategic Disadvantage for VI users • Scanning strategy determines the quality of spatial information acquisition • But better scanning strategy possible only with knowledge of spatial information • Sighted users take a quick look at an image which helps them to scan the image lot more efficiently • VI users do not have the luxury of a quick glance! • Coding strategy determines the quality of mental representation • Mental models coded on body centric reference frame less useful for complicated spatial analysis • External reference frames help to code better quality mental models • VI users need improved scanning strategies for acquiring suitable external reference frames • Because VI users are disadvantaged to find a quality scanning strategy, they are also disadvantaged to find a quality coding strategy
Solution Options • VI users clearly need external help in finding suitable external reference frames • Atlas.txt solution • Identify several reference frames and present summary coded in each of these • VI users may be familiar with some spatial layouts • E.g. telephone key pad and clock face • Use several of these to code summary information “Some wards in the east and central parts (3,5,6,9) of the city have high percentage of unemployed people aged 16-74 above 03.51%” • E.G. ‘east and central parts’ can also be expressed by (3,5,6,9) each number referring to a location on the telephone keypad layout