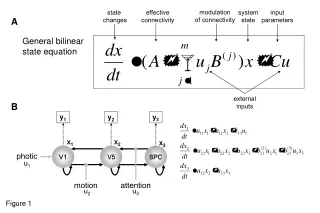
Download
1 / 45
450 likes | 877 Views
SUPERVISED METHODS CAN ONLY VALIDATE OR REJECT HYPOTHESES. CAN NOT LEAD TO DISCOVERY OF ... Bax, IGF-BP3, Fas, killer/DR5, Noxa, PIG3, p53AIP1, PIDD, Puma ...

E N D
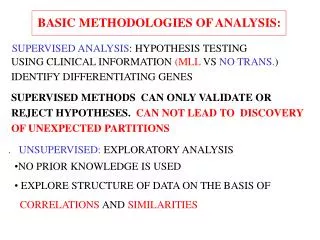
Basic methodologies1 . UNSUPERVISED: EXPLORATORY ANALYSIS • NO PRIOR KNOWLEDGE IS USED • EXPLORE STRUCTURE OF DATA ON THE BASIS OF • CORRELATIONS AND SIMILARITIES BASIC METHODOLOGIES OF ANALYSIS: SUPERVISED ANALYSIS: HYPOTHESIS TESTING USING CLINICAL INFORMATION (MLL VS NO TRANS.) IDENTIFY DIFFERENTIATING GENES SUPERVISED METHODS CAN ONLY VALIDATE OR REJECT HYPOTHESES. CAN NOT LEAD TO DISCOVERY OF UNEXPECTED PARTITIONS
Advantages of SPC • Scans all resolutions (T) • Robust against noise and initialization -calculates collective correlations. • Identifies “natural” () and stable clusters (T) • No need to pre-specify number of clusters • Clusters can be any shape • Can use distance matrix as input (vs coordinates)
stability T larger T - tighter, more stable cluster
P53 p53 IS A CENTRAL PLAYER IN APOPTOSIS AND IN CELL CYCLE CONTROL. IT IS A TRANSCRIPTION FACTOR.
PRIMARY TARGETS OF P53 K. Kannan, D. Givol, G. Rechavi,... G. Getz, I. Kela, Oncogene 2001 TEMPERATURE SENSITIVE MUTANT P53, ACTIVATE - 32 C (t=0) MEASURE EXPRESSION AT t=0,2,6,12,24 h (use t=0 as control) REPEAT IN PRESENCE OF CYCLOHEXIMIDE (CHX)t=0,2,4,6,9,12 (CHX INHIBITS PROTEIN SYNTHESIS) IDENTIFY UPREGULATED GENES USING FILTER: AT LEAST 2.5 FOLD INCREASE AT 3 OR MORE TIME POINTS (SEPARATELY IN EACH OF THE TWO EXPTS, -CHX AND +CHX) 38 CANDIDATE PRIMARIES: EFFECT OF FILTERING??? RELEASE FILTER FROM +CHX CLUSTERING: 3847 (31)
REDUCE EFFECT OF FILTERING BY CLUSTERING c a %candidate primary targets K.Kannan et al, Oncogene X – 38 candidate primary targets
INHIBITION OF P53-INDUCED APOPTOSIS BY IL-6 Lotem…Rechavi, D. Givol, L. Sachs PNAS 2003 BY REDUCING TEMPERATURE TO 32 DEGREES, P53 ASSUMES WILD-TYPE CONFORMATION, IS ACTIVATED AND INDUCES APOPTOSIS ADDING THE CYTOKINE IL-6 INHIBITS THE APOPTOTIC PROCESS QUESTION: WHERE DOES IL-6 INTERFERE IN THE CASCADE INITIATED BY P53? AT TOP?AT BOTTOM?
IL-6 ?? Apoptosis IL-6 ?? QUESTION: WHERE DOES IL-6 INTERFERE IN THE CASCADE INITIATED BY P53? AT TOP?AT BOTTOM? Activated p53 Transactivation Other activities (C terminal = TFIIH binding?) (N terminal = SH3 binding?) p21/ Waf1 Bax, IGF-BP3, Fas, killer/DR5, Noxa, PIG3, p53AIP1, PIDD, Puma Other genes etc, etc, etc ?? Caspese cascade Growth arrest
333 GENES UPREGULATED BY P53 – NOT AFFECTED BY IL-6 309 GENES DOWNREGULATED BY P53 ALSO NOT AFFECTED
IL-6 ?? Apoptosis IL-6 ?? QUESTION: WHERE DOES IL-6 INTERFERE IN THE CASCADE INITIATED BY P53? AT TOP?AT BOTTOM? ANSWER: AT BOTTOM!! Activated p53 Transactivation Other activities (C terminal = TFIIH binding?) (N terminal = SH3 binding?) p21/ Waf1 Bax, IGF-BP3, Fas, killer/DR5, Noxa, PIG3, p53AIP1, PIDD, Puma Other genes etc, etc, etc ?? Caspese cascade Growth arrest
Colon Cancer Data COLON CANCER DATA Alon,Barkai, Notterman, Gish, Ybarra, Mack, Levine: PNAS 96, 6745 (1999) AFFYMETRIX; 40 TUMOR, 22 NORMAL TISSUES 2000 (OUT OF 6500) GENES OF HIGHEST INTENSITY Aij = EXPRESSION LEVEL OF GENE i IN TISSUE j
Colon Cancer Data COLON CANCER DATA:
Two-way clustering S1(G1) G1(S1) TWO-WAY CLUSTERING:
Two way clustering-ordered TWO-WAY CLUSTERING: S1(G1) G1(S1)
2-way clustering - tissues TWO-WAYCLUSTERING – TISSUES 1. IDENTIFY TISSUE CLASSES (TUMOR/NORMAL)
2-way clustering –genes Erel Ribosomal proteins Cytochrome C metabolism HLA2 TWO-WAY CUSTERING – GENES - G1(S1) 2.FIND DIFFERENTIATING AND CORRELATED GENES EACH GENE = POINT IN 62 DIMENSIONAL SPACE
Two-way clustering TWO-WAY CLUSTERING: Can one improve?
C2WC - Motivation COUPLED TWO-WAY CLUSTERING MOTIVATION: ONLY A SMALL SUBSET OF GENES PLAY A ROLE IN A PARTICULAR BIOLOGICAL PROCESS; THE OTHER GENES INTRODUCE NOISE, WHICH MAY MASK THE SIGNAL OF THE IMPORTANT PLAYERS. ONLY A SUBSET OF SAMPLES EXHIBIT THE EXPRESSION PATTERNS OF INTEREST. SHOULD USE A SUBSET OF GENES TO STUDY A SUBSET OF THE SAMPLES (AND VICE VERSA) PROBLEM: ENORMOUS NUMBER OF SUBMATRICES
C2WC - method COUPLED TWO-WAY CLUSTERING PICK ONE STABLEGENE CLUSTER. REPRESENT TISSUES BY THE EXPRESSION LEVELS OF THESE GENESONLY. ANALYZE ALL TISSUE CLUSTERS BY USING ALL GENE CLUSTERS, ONE AT A TIME. LOOK FOR INTERNAL STRUCTURE, SUB-CLUSTERS. USE ALL STABLE TISSUE CLUSTERS TO CLASSIFY GENES; IDENTIFY GENE CLUSTERS THAT GOVERN BIOLOGICAL PROCESSES. ITERATE THE PROCEDURE UNTIL NO NEW STABLE CLUSTERS EMERGE
tissues 1 G4 G12 COUPLED TWO-WAY CLUSTERING OF COLON CANCER: TISSUES S1(G4) S1(G12)
CTWC colon cancer - tissues Tumor Normal S17 Protocol A Protocol B COUPLED TWO-WAY CLUSTERING OF COLON CANCER: TISSUES S1(G4) S1(G12)
genes1 G1(S17) S17
CTWC of colon cancer - genes G1(S17) COUPLED TWO WAY CLUSTERING OF COLON CANCER - GENES USING ONLY THE TUMOR TISSUES TO CLUSTER GENES, REVEALS CORRELATION BETWEEN TWO GENE CLUSTERS; CELL GROWTH AND EPTHELIAL G1(S1) COLON CANCER - ASSOCIATED WITH EPITHELIAL CELLS
glioblastoma 174 genes separate (at FDR of 5%) PrGBM from LGA + ScGBM S Godard, G Getz, H Kobayashi, P Farmer, M Delorenzi, M Nozaki, A-C Diserens, M-F Hamou, P-Y Dietrich, J-G Villemure, R C. Janzer, P Bucher, R Stupp, N de Tribolet, E Domany, M E. Hegi GLIOBLASTOMA: CLONTECH ARRAYS 1185 Genes, 36 Samples 12 Astrocytoma(II) 4 secondary GBM 17 Primary GlioBlastoMa 3 Cell Lines
glioblastoma FILTERING 358 HIGHLY VARYING GENES GLIOBLASTOMA: S3 S1(G1) Coupled Two-Way Clustering (CTWC) of 358 Genes and 36 Samples S2 T G12 GENES G5 Astrocytoma(II) Secondary GBM Primary GlioBlastoMa Cell Lines G1(S1)
S1(G5) Super-Paramagnetic Clustering of All Samples Using Stable Gene Cluster G5 S1(G5) S14 S13 S12 S11 S10 Fig. 2B
validation G5Ver
THE GENES OF G5 THE GENES OF G5: AB004904 STAT-induced STAT inhibitor 3 M32977 VEGF M35410 IGFBP2 X51602 VEGFR1 M96322 gravin AB004903 STAT-induced STAT inhibitor 2 PTN X52946 J04111 c-jun X79067 TIS11B VEGF AND ITS RECEPTORS – INSTRUMENTAL IN ANGIOGENESIS; INDUCED GROWTH OF BLOOD VESSELS, ESSENTIAL FOR GROWTH BEYOND A CRITICAL SIZE. THE COEXPRESSION OF IGFBP2 WAS INDEPENDENTLY VERIFIED; 1ST EVIDENCE FOR POSSIBLE ROLE IN ANGIOGENESIS.
Analysis of cervical cancer data ‘g’ - good ‘b’ - bad ‘o’ - other S 02 - 1 e g ‘S’ - sample ‘C’ - cell line Batch #1,2,3 ‘a’ - adeno ‘e’ - epidermal ‘n’ - normal Sample number C. Rosty, F. Radvanyi, N. Stransky …M. Sheffer, D. Tsafrir, I. Tsafrir …X. Sastre, Oncogene (2005) Total of 45 samples/chips: • 5 Cell lines. • 5 Normal samples. • 35 tumor samples, 5 of which are repeats. • 10 adenocarcinoma tumors: 4 are HPV-16 and 6 are HPV-18. • 20 epidermal carcinoma: 12 HPV-16, 6 HPV-18, 1 HPV-33 and 1 HPV-99. MAIN AIM: PREDICT OUTCOME AT DISCOVERY
AIM: IDENTIFY GENES WHOSE EXPRESSION LEVEL, MEASURED AT THE TIME OF DISCOVERY OF THE MALIGNANCY, IS INDICATIVE OF OUTCOME
WE USED STANDARD STATISTICAL TESTS LOOKING FOR GENES WHOSE EXPRESSION LEVELS SEPARATE PATIENTS WITH GOOD OUTCOME FROM PATIENTS WITH BAD OUTCOME. NO SUCH GENES WERE FOUND PERHAPS TRY UNSUPERVISED METHODS (E.G. CLUSTERING) ???
S1(G1) G1(S1) Two-way Clusteringof cervical data Two clustering operations: • 35 samples based on the expression of 5000 probes; S1(G1) • 5000 probes in 35 dimensional space; G1(S1)
S1(G7) G7 G3 S1(G10) G10 S1(G3) Coupled Two-Way Clustering of Cervix Cancer 35 SAMPLES (REMOVE CELL LINES AND REPLICATES) 5000 GENES (PASSED VARIANCE FILTER) FOCUS ON G3: CLUSTER OF 148 GENES (163 probe sets)
“good” normal cell lines S1(G7) G7 G3 S1(G10) G10 S1(G3) Coupled Two-Way Clustering of Cervical Cancer Getz et al PNAS 2000 FOCUS ON G3 (PROLIFERATION CLUSTER, GO): 1. Cluster samples using 163 probe sets; 2. SORT (using SPIN )
S19-1noo S28-1noo S07-1noo S35-1noo S02-1noo S29-3a6g S26-2a8+ S20-2e8g S03-1e8g S34-2e8g S23-1a8g S13-1a8b S31-3a6g S08-1e6g S23-2a8g S10-1e6b S18-1e8b S04-1a8b S12-1e8b S05-1a8b S11-1e3b S25-3a6g S22-1e6g S27-1e6b S32-2e6g S17-3a6o S33-1e6b S15-2e6g S09-1e6b S18-2e8b S06-1e6+ S14-1e6b S33-2e6b S15-1e6g S21-2a8o S24-1e6b S01-1e6g S14-3e6b S30-2e8b C01-3c8o S16-1e9o C06-3c8o C07-3c6o C03-3c6o C05-3c8o 163 probes ‘Good outcome’ sample cluster(AACR 2004) Low expression level of the “Proliferation Cluster”indicates good outcome High expression: no prediction Normal samples Good outcome Cell-line samples Validated by RT-PCR of 20 genes over 70 samples
P53 and Rb control (restrain) proliferation (inactivating E2F) Activity of P53 and Rb is controlled by E6/E7 Viral Protein Content. E6/E7 Protein Concentration controlled by E6/E7 RNA Expression Level use TF binding site sequence information to derive network E7 RNA: Corr=0.54,0.62 Ordered Expression Matrix of 20 proliferation Genes HPV16/HPV18 E7 DNA: Corr=0.34,0.55 E6/E7 RNA Level controlled by E6/E7 DNA COPY NUMBER
AIM: IDENTIFY GENES WHOSE EXPRESSION LEVEL, MEASURED AT THE TIME OF DISCOVERY OF THE MALIGNANCY, IS INDICATIVE OF OUTCOME FINDING: A CUSTER OF 150 GENES, ASSOCIATED WITH CELL PROLIFERATION, HAS RELATIVELY LOW EXPRESSION LEVELS IN A SUBSET OF THE “GOOD OUTCOME” PATIENTS. VALIDATION (PCR) FINDING: CELL PROLIFERATION EXPRESSION LEVEL IS CONTROLLED BY AMOUNT OF VIRAL PROTEINS E6, E7, WHICH IS GOVERNED BY NUMBER OF DNA COPIES THAT WERE INSERTED BY THE VIRUS Rosty et al, Oncogene 2005
signature algorithm J. Ihmels, G. Friedlander,S. Bergmann,O. Sarig, Y Ziv, N. Barkai
recurrence yeast genome: 6400 genes, 1000 “conditions” (chips) ( • Ncore = 37,73,145 genes for ribosomal proteins • 132 genes for biosynthesis • Each used as input GIref, returns (nearly same) gene signature Sref • add Nrandrandomly picked genes • GIinput set of Ncore + Nrandgenes, returns gene signatures SI • Recurrence of Sref is measured by • Overlap = Fraction of shared genes by Sref and SI • (b) Use as GIrefsets of genes with shared regulatory sequences. • Only the truely coregulated ones are returned in Sref; recurrent.
pathways • Tricarboxyl acid (TCA) cycle: known genes in E.coli, • find (34) homologues in yeast used as GI ; produce SIwhich • excludes the wrong genes and misses only few correct ones • (b,c) Identify two autonomous subparts of the cycle