Effective Connectivity Modulation in Neuronal Systems: State Equations and Task Factors
Explore the modulation of connectivity system state changes with effective connectivity through a general bilinear state equation with external inputs A, B, y1, y3, y2, x1, x2, x3, photic, V1, V5, SPC, u1, attention, motion, u3, u2, and more. Investigate hemodynamic responses and neuronal input state variables in this comprehensive study. Understand the impact of attention and motion on different brain regions using detailed figures and equations.

Effective Connectivity Modulation in Neuronal Systems: State Equations and Task Factors
E N D
Presentation Transcript
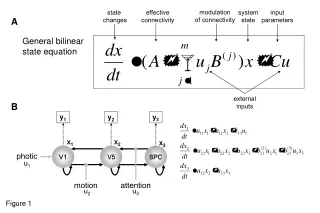
modulation of connectivity systemstate input parameters state changes effective connectivity General bilinear state equation externalinputs A B y1 y3 y2 x1 x2 x3 photic V1 V5 SPC u1 attention motion u3 u2 Figure 1
neuronal input state variables hemodynamic response Figure 2
A B Attention Photic .52 (98%) .37 (90%) SPC .42 (100%) .56 (99%) .69 (100%) .47 (100%) V1 IFG .82 (100%) Motion V5 .65 (100%) Figure 3
Task factor Task 2 Task 1 T1/S1 T1/S1 Stim 1 Stimulus factor Stim 2 T1/S2 T1/S2 A B y1 Stim 1Task 2 Stim 2Task 2 Stim 2Task 1 Stim 1Task 1 y2 Figure 4
y1 y2 C D – – +++ Stimulus S1 + x2 x1 +++ Stimulus S2 + +++ + Task T1 Task T2 Figure 4 (continued)
mod2 mod1 x3 stim2 x1 x2 stim1 A +++ + – + +++ + + +++ +++ – – Figure 5A
x1 103 y1 x2 103 y2 x3 103 y3 B stim1 stim2 mod1 mod2 mod1 mod2 Figure 5B
inhibitory interneurons 2 3 spiny stellate cells 1 pyramidal cells Intrinsic Forward Backward Lateral Input u Figure 6
inhibitory interneurons spiny stellate cells pyramidal cells Extrinsic lateral connections Extrinsic forward connections Intrinsic connections Extrinsic backward connections Figure 7
standard (predicted) standard (observed) oddball (predicted) oddball (observed) 30 mode 1 PC 20 10 0 -10 OF OF -20 0 200 400 30 mode 2 20 10 2.17 (95%) 2.74 (98%) 3.58 (100%) 4.09 (100%) STG 0 -10 3.23 (97%) -20 0 200 400 A1 A1 30 1.93 (100%) mode 3 20 10 0 -10 input -20 600 0 200 400 0 time (ms) 0 200 400 Figure 8