Download
1 / 4
0 likes | 171 Views
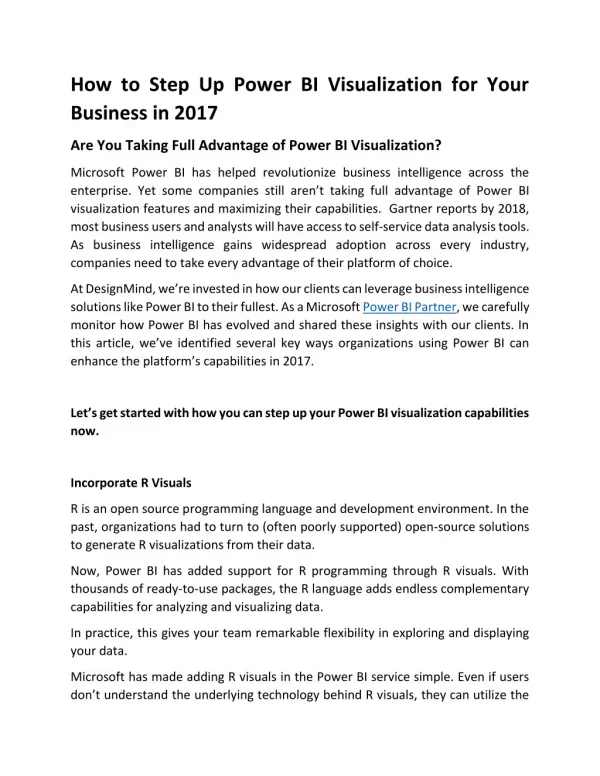
The amount of data industries are generating is huge. It stuns us to know that every day 1.145 Trillion MB of data is generated. This number will swell up every day and will likely touch the mark of 180 zettabytes by the time we reach 2025.<br><br>Data abundance is not always good because organizations cannot handle this humongous amount of data. Only a handful of organizations successfully derive the inputs from this data and visualize it effectively.

E N D
How to Use Data Visualization with Power BI: 2023 Edition
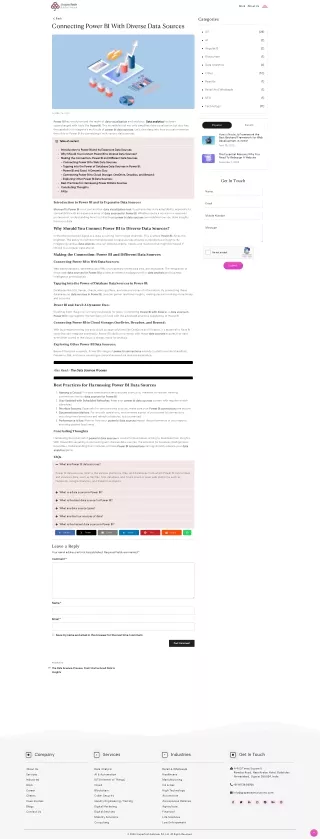
How to Use Data Visualization with Power BI: 2023 Edition In the modern era where data is at the forefront, extracting valuable insights from extensive information is crucial for enterprises and institutions. Use Data Visualization with Power BI, Microsoft's leading data visualization tool, has continuously evolved to cater to these needs. The 2023 edition brings even more robust features, streamlining the process of converting raw data into insightful visualizations. Key Features: Enhanced Data Connectors: Seamless integration with a wider range of data sources, ensuring compatibility and ease of data import. • Advanced AI-powered Insights: Automated suggestions for chart types and layouts based on your data, making the visualization process more intuitive. • Interactive Dashboards: Improved drag-and-drop functionality and real-time data updates ensure that your reports are always current and dynamic. •
Collaboration Tools: Share and co-edit your visualizations with team members, fostering a collaborative data analysis environment. • Customization Options: More design themes, color palettes, and advanced formatting options allow users to align visuals with their branding. • Conclusion : Power BI's 2023 edition is a game-changer for data visualization enthusiasts. Whether you're a business analyst, data scientist, or someone who's just passionate about data, this tool ensures that your data not only speaks but tells a compelling story. Equip yourself with Power BI and elevate your data presentation game.