Download
1 / 1
10 likes | 341 Views
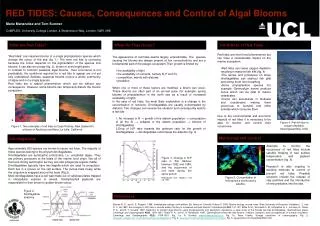
Marie Manandise and Tom Sumner. CoMPLEX, University College London, 4 Stephenson Way, London, NW1 2HE. a. b. RED TIDES: Causes, Consequences and Control of Algal Blooms.

E N D
Marie Manandise and Tom Sumner CoMPLEX, University College London, 4 Stephenson Way, London, NW1 2HE a. b. RED TIDES: Causes, Consequences and Control of Algal Blooms “Red tides” are massive blooms of a single phytoplankton species which change the colour of the sea (fig. 1). The term red tide is confusing because the colour depends on the pigmentation of the species that blooms. It can also be orange (fig. 2), brown or even bright green. In contrast to common seasonal algal blooms, their occurrence is not predictable; the conditions required for a red tide to appear are not yet fully understood. Besides, seasonal blooms involve a whole community of algae and not a single species. Red tides are a natural phenomenon which can be without any consequence. However, some blooms can temporarily disturb the marine ecosystem. Approximately 200 species are known to cause red tides. The majority of these species belong to the phylum dinoflagellates. Dinoflagellates are autotrophic protozoans, i.e. unicellular algae. They are primary producers at the basis of the marine food chain. Not all of them are strictly autotrophic as they can also phagocyte organic matter. Dinoflagellates typically have two flagella which are used for propulsion. Each lies in a groove on the cell surface. The sulcus trails freely, while the cingulum is wrapped around the body (Fig 2). Most dinoflagellates have a cell wall made out of cellulose plates trapped in intracellular vesicles or alveoli. Xantophophyll pigments are responsible for their brown to golden-brown colour. What are Red Tides? When Do They Occur? The Effects of Red Tides • Red tides are short livedphenomenon but can have a considerable impact on the marine ecosystem. • Red tides can cause oxygen depletion resulting in massive fish kills (fig. 4) • The spines and protusions on many dinoflagellates can obstruct fish gills preventing them from breathing • Some phytoplankton species (for example Gymnodium breve) produce toxins which can be fatal to marine veterbrates • Toxins can accumulate in molluscs and crustaceans making them poisonous to humans and other animals which consume them • Due to the environmental and economic impacts of red tides it is necessary to be able to monitor and control their occurrence. • The appearance of red tides seems largely unpredictable. The species causing the blooms are always present at low concentrations and are a fundamental part of the pelagic ecosystem.Their growth is limited by: • the availability of light • the availability of nutrients, namely N, P and Fe • competition, mainly with diatoms • predation • When one or more of these factors are modified, a bloom can occur. These blooms are often part of an annual cycle (for example: spring blooms of phytoplankton in the north sea as a result of increased availability of light). • In the case of red tides, the most likely explanation is a change in the concentration of nutrients. Dinoflagellates are usually outcompeted by diatoms. Two changes can reverse the situation and consequently lead to a red tide: • An increase in N growth of the diatom population consumption of all the Si collapse of the diatom population blooms of dinoflagellates • Drop of N:P ratio towards the optimum ratio for the growth of dinoflagellates dinoflagellates outcompete the diatoms (fig. 3) Figure 4. Fish kill due to oxygen depletion, Narrangasett Bay, USA. Figure 1. Two examples of red tides a) Cape Rodney, New Zealand b) a bloom of Noctiluca scintillans, La Jolla, California. Monitoring and Control Dinoflagellates • Attempts to monitor the occurrence of red tides include satellite imaging of sea surface temperature and pigment concentration (fig. 5). • Research is also ongoing to develop methods to control or prevent red tides. Possible solutions include the release of clay particles and the introduction of new predators into the sea. Figure 3. Change in N:P ratio in Tolo Harbour between 1982 and 1989, and the occurrence of red tides during the same period. Reproduced from Hodgkiss and Ho, 1997. Figure 5. Concentration of chlorophyll a monitored by satellite. Figure 2. Dinoflagellate anatomy References Barnes R. D., and E. E. Ruppert, 1996. Invertebrate zoology, sixth edition. Ed. Harcourt, Orlando; Dubois P. 2005. Marine biology, course notes (Free University of Brussels); Hodgkiss I. J., and K. C. Ho,1997. Are changes in N:P ratio in coastal waters the key to increased red tieds blooms? Hydrobiologia352: 141-147; Millie D. M., Schofield O. M., Kirkpatrick G. J., Johnsen G., Tester P. A., and B. T. Vinyard, 1997. Detection of harmful algal blooms using photopigments and absorption signatures: a case study of the Florida red tide dinoflagellate, Gymnodinium breve. Limnology and Oceanography42(5): 1240-1251; Tester P. A., and K. A. Steidinger, 1997. Gymnodinium breve red tide blooms: initiation, transport, and consequences of surface circulation. Limnology and Oceanography42(2): 1039-1051; Fig. 1a. N. Godfrey www.niwascience.co.nz; Fig. 1b. Peter Franks, Scripps intstitution of oceanography; Fig. 2. www.geo.ucalgary.ca/~macrae/palynology/dinoflagellates/; Fig. 4. www.geo.brown.edu/georesearch/insomniacs; Fig. 5. sg.geocities.com/myredtide/250m.htm