Download
1 / 12
120 likes | 345 Views
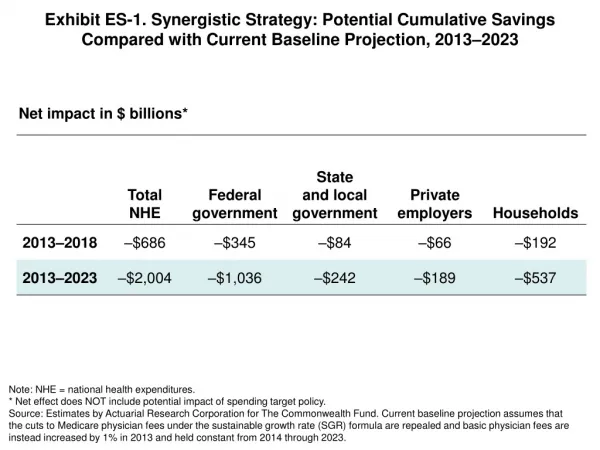
Exhibit ES- 1 . Synergistic Strategy: Potential Cumulative Savings Compared with Current Baseline Projection, 2013–2023. Net impact in $ billions *. Note: NHE = national health expenditures . * Net effect does NOT include potential impact of spending target policy.

E N D
Exhibit ES-1. Synergistic Strategy: Potential Cumulative Savings Compared with Current Baseline Projection, 2013–2023 Net impact in $ billions* Note: NHE = national health expenditures. * Net effect does NOT include potential impact of spending target policy. Source: Estimates by Actuarial Research Corporation for The Commonwealth Fund. Current baseline projection assumes that the cuts to Medicare physician fees under the sustainable growth rate (SGR) formula are repealed and basic physician fees are instead increased by 1% in 2013 and held constant from 2014 through 2023.
Exhibit ES-2. Projected National Health Expenditures (NHE), 2013–2023: Potential Impact of Synergistic Strategy NHE in $ trillions Note: GDP = gross domestic product. Source: Estimates by Actuarial Research Corporation for The Commonwealth Fund. Current baseline projection assumes that the cuts to Medicare physician fees under the sustainable growth rate (SGR) formula are repealed and basic physician fees are instead increased by 1% in 2013 and held constant from 2014 through 2023.
Exhibit ES-3. Cumulative Net Impacts of Payment, Engaging Consumers, and Systemwide Policies, 2013–2023 Net savings in $ billions Note: NHE = national health expenditures. Totals may not add because of rounding. * Net savings do NOT include the potential impact of the spending target policy. Malpractice savings included in impact of provider payment reforms. ** Cumulative NHE impact adjusted for potential overlap of component policy impacts. Source: Estimates by Actuarial Research Corporation for The Commonwealth Fund. Current baseline projection assumes that the cuts to Medicare physician fees under the sustainable growth rate (SGR) formula are repealed and basic physician fees are instead increased by 1% in 2013 and held constant from 2014 through 2023.
Exhibit 1. International Comparison of Spending on Health, 1980–2010 Average spending on healthper capita ($US PPP) Total health expenditures aspercent of GDP Notes: PPP = purchasing power parity; GDP = gross domestic product. Source: Commonwealth Fund, based on OECD Health Data 2012.
Exhibit 2. Medicare Spending per Enrollee Projected to Increase More Slowly Than Private Insurance Spending per Enrollee and GDP per Capita Annual rate of growth (percent) Note: GDP = gross domestic product. Source: CMS Office of the Actuary, National Health Expenditure Projections, 2011–2021, updated June 2012.
Exhibit 3. Premiums Rising Faster Than Inflation and Wages Cumulative changes in insurance premiums and workers’ earnings, 1999–2012 Projected average family premium as a percentage of median family income, 2013–2021 Percent Percent 180% 172% 47% 38% Projected Sources: (left) Kaiser Family Foundation/Health Research and Educational Trust, Employer Health Benefits Annual Surveys, 1999–2012; (right) authors’ estimates based on CPS ASEC 2001–12, Kaiser/HRET 2001–12, CMS OACT 2012–21.
Exhibit 4. Projected U.S. National Health Expenditures (NHE) by Source, 2013–2023 NHE in $ billions % GDP: 17.9%18.7%20.5% Note: GDP = gross domestic product. Source: Estimates by Actuarial Research Corporation for The Commonwealth Fund.
Exhibit 5. High Performance Health System Criteria for Developing Options to Stabilize Spending Growth
Exhibit 6. Synergistic Strategy: Potential Cumulative Savings Compared with Current Baseline Projection, 2013–2023 Net impact in $ billions* Note: NHE = national health expenditures. * Net effect does NOT include potential impact of spending target policy. Source: Estimates by Actuarial Research Corporation for The Commonwealth Fund. Current baseline projection assumes that the cuts to Medicare physician fees under the sustainable growth rate (SGR) formula are repealed and basic physician fees are instead increased by 1% in 2013 and held constant from 2014 through 2023.
Exhibit 7. Synergistic Strategy: Cumulative Savings, 2013–2023 Notes: SGR = sustainable growth rate formula; GDP = gross domestic product. * Malpractice policy savings included with provider payment policies. ** Target policy was not scored.
Exhibit 8. Projected National Health Expenditures (NHE), 2013–2023: Potential Impact of Synergistic Strategy NHE in $ trillions Note: GDP = gross domestic product. Source: Estimates by Actuarial Research Corporation for The Commonwealth Fund. Current baseline projection assumes that the cuts to Medicare physician fees under the sustainable growth rate (SGR) formula are repealed and basic physician fees are instead increased by 1% in 2013 and held constant from 2014 through 2023.
Exhibit 9. Impact of Synergistic Strategy on Projected Annual Hospital and Physician Spending, 2013–2023 Spending in $ billions • Projected growth of hospital spending, 2013–2023: • Baseline projection: 82% (6.2% annual) • Net of policy impact: 67% (5.3% annual) • Projected growth of physician spending, 2013–2023: • Baseline projection: 88% (6.5% annual) • Net of policy impact: 77% (5.9% annual) Source: Estimates by Actuarial Research Corporation for The Commonwealth Fund. Current baseline projection assumes that the cuts to Medicare physician fees under the sustainable growth rate (SGR) formula are repealed and basic physician fees are instead increased by 1% in 2013 and held constant from 2014 through 2023.


