Fuel Efficient Bearing Systems
Rail Sciences Inc. Fuel Efficient Bearing Systems. Presented by Dave Shannon, Amsted Rail John Makinson, Rail Sciences Inc. Synopsis. Summarize resistive forces that exist in freight rail cars Narrow our focus to an evaluation of rolling resistance in loaded journal bearings

Fuel Efficient Bearing Systems
E N D
Presentation Transcript
Rail Sciences Inc. Fuel Efficient Bearing Systems Presented by Dave Shannon, Amsted Rail John Makinson, Rail Sciences Inc.
Synopsis • Summarize resistive forces that exist in freight rail cars • Narrow our focus to an evaluation of rolling resistance in loaded journal bearings • Share our analysis of these findings to then identify the key features in selecting fuel efficient bearing systems
Train Energy • Locomotive power provides the pulling (pushing) force for the railcars. • As the train moves much of the generated power is dissipated by the various parts of this complex mechanical system. • Engine power is lost in: • transmission • vehicle slip • overcoming motion resistance
Contributors to Loss of Motive Force • No control exists over some resistive forces: • wind speed or direction • the established track grade • physical effects due to outside temperature. • Operating requirements or practices set others: • rate of acceleration • use of rail lubrication • braking forces. • Equipment design features establish a third group: • engine operating efficiencies • the equipment's aerodynamic features • achieved traction versus undesired drag.
AAR Train Energy Model (TEM) • TEM model evaluated the vehicle's resistance under various standard operational scenarios.
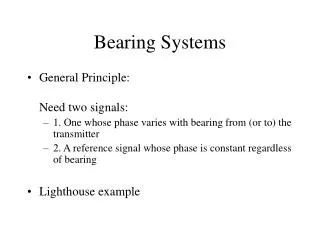
The sources of tapered roller bearing turning resistance are generated in three areas: rolling/sliding contact including cage interactions lubricant effects such as churning and viscous drag seal drag Bearing Rolling Resistance
Rail Sciences Loaded Bearing TestEvaluation by an Independent Test Laboratory
Test Procedure • Test at three loads. • 1,200 lb per bearing (low load) • 5,200 lb per bearing (empty car) • 35,700 lb per bearing (286,000lb car) • Test from 5 mph to 80 mph • (36-inch diameter wheel) • Initial bearing run-in 15,000 miles
Test Procedure (continued) • Beginning of Test • 5 mph • Run for 5 minutes • Check average bearing temperature • Check for temperature increase of less than 0.07°F/min • Data is collected at 2 Hz for 2 minutes • Results averaged 120 samples • Speed increased by 5 mph and procedure repeated • Entire 5 to 80 mph test is repeated on same bearings with seals removed.
Observations • Under these conditions, • Torque increases with: • Increasing load • Increasing speed • Decreasing temperature • Bearings were allowed to reach ‘their own’ steady-state temperature. • Simple example of what happens when a bearing hunts for its steady state temperature. • Torque -> heat -> lower torque -> lower heat ->higher torque-> etc.
RSI General Test Conclusions • The bearing test rig has repeatability and reproducibility in measuring the rotational resistance of the test bearings. • The greatest controlled variable to rotational resistance is load applied on the bearing. • The largest influence on rotational resistance is temperature of the bearings. • Contribution to rotational resistance from the seals is approximately constant with respect to rotational speed at a given load. • The [percentage] contribution of rotational resistance due to seals decreases with an increase in load.
RSI Torque & Temperature Findings • The Brenco Class F bearings with labyrinth seals on average stabilized at a significantly lower temperature than the Brenco Class F bearings with either optimized/no garter spring (11ºF) or standard (22ºF)radial lip seals. • The Brenco Class F labyrinth seals averaged 1.0 lb.ft. less torque per bearing than the Brenco Class F with optimized /no garter spring seals and 2 ft.lbs. less torque per bearing than the standard radial lip seals at equivalent temperatures. • Overall, the Brenco Class K labyrinth sealsrequire 1.4 lb.ft. less torque per bearing than the Brenco Class K optimized radial lip seals.
Fuel Consumed and Operating Cost Comparison for Available Class K Seals • 46% savings in fuel due to seal drag from lowest to highest torque design • Equates to $50 savings per bearing per year at fuel cost of $2.00 per gallon
Findings from TEM Simulation • Western coal route simulation results • Low torque labyrinth vs. standard established for radial lip seal equipment • 1.6% TEM calculated fuel savings • 0.4 gallons per 1000 miles per bearing
Areas Identified for Improvement • Roller bearings have a direct effect on the operating efficiency of a train • The three most critical items to achieve more fuel efficient bearings are: • high reliability bearing components to eliminate unscheduled train stops • grease selection for cold climates • seal selection for high utilization services
Rail Sciences Inc. Fuel Efficient Bearing Systems Presented by Dave Shannon, Amsted Rail John Makinson, Rail Sciences Inc.