Google Sheets Pivot Tables
Pivot tables in Google Sheets are a game-changer for efficient data analysis. They are versatile, flexible, and essentially faster to use for exploring your data than spreadsheet formulas.

Google Sheets Pivot Tables
E N D
Presentation Transcript
The Ultimate Guide to Uing Pivot Tale in Google heet 0 HAR G N k s A Overvie With huge amount of data, it can e challenging to come up ith clearcut concluion or ummarize information from a imple preadheet tale vie. That’ h pivot tale and chart are important. Pivot tale in Google heet are a gamechanger for e몭cient data anali. The are veratile, 몭exile, and eentiall fater to ue for exploring our data than preadheet formula. Thi guide take a comprehenive look into pivot tale in Google heet, h ou hould ue them, and a fe tip on creating our 몭rt pivot tale. What are Pivot Tale & Chart and doe Google heet have them?
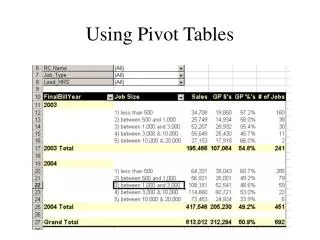
Google heet have them? From a 30,000 foot perpective, a pivot tale i a ummar of data election ou alread entered into or aved in Google heet. Thee data election erve a the data ource that ou can condene into aggregated form to extract the data ou ant to 몭nd. For example, uing pivot tale, ou can have a clear vie of the amount of revenue ou generated from a peci몭c product over a certain period in a certain tore location. Pivot tale are compoed of column, ro, page, and data 몭eld that can e moved around, helping ou iolate, group, expand, and um our data in realtime. entiall, pivot tale ummarize large et of data, giving ou a ird’ ee vie of peci몭c data et, helping ou organize and undertand our ra information etter. To explain thi further, think of our tandard preadheet. Thee tpicall have “몭at data” repreented vertical (ro) and horizontal (column) axe. To get our deired inight, ou ill need to add data on another level. Uing the tale aove a an example, ou egin ith ever ale a it on ro, ith each column o몭ering di몭erent data aout the ale. hi몭ing (or pivoting) the tale’ axe let ou add another dimenion to our data. Depending on the information ou ant to derive, uing pivot tale can make our data look like thi: Intead of looking at our information aed on individual ale, ou get aggregated
data of the numer of Unit ou old in each Location for ever hip Date.data of the numer of Unit ou old in each Location for ever hip Date. While ou can ue formula to derive man inight from our data, a pivot tale help ou extract our deired information much fater and eaier, and it reduce the chance of human error and data inaccuracie. Additionall, pivot tale allo ou to generate ne report uing the ame dataet in a fe click ithout tarting from cratch. The ene몭t of Pivot Tale Pivot tale help ou manage, ort, and analze our data more e몭cientl, along ith thee other advantage. Quick and ea to ue Pivot tale are uerfriendl and don’t require much e몭ort or a teep learning curve to ue. A long a ou have our ra data in our preadheet read, ou can eail create our pivot tale in jut a fe click. You on’t need to ue formula and extract data manuall aed on the peci몭c inight ou ant to derive. Thi ave ou a lot of time and e몭ort, alloing ou to focu on other more important data tak. Create data intantl A pivot tale allo ou to create data intantl, hether ou ue preadheet formula or program equation directl into the pivot tale. Thi allo ou to compare variou data in econd and derive the information ou need ith a little e몭ort a poile. Generate accurate report quickl Traditional a of generating report through preadheet can eat up a chunk of our time and energ, making pivot tale a more e몭cient method of creating our data preentation. Pivot tale let ou create variou report uing the ame ra data in one 몭le, ithout coping and pating the information into ne heet. Uing pivot tale alo reduce the chance of human error in our data, alloing ou to generate accurate report. ummarize large data et eail Pivot tale in Google heet treamline the proce of ummarizing large quantitie of data in econd. Thee can aggregate our data into imple and eail comprehenile
data in econd. Thee can aggregate our data into imple and eail compreheniledata in econd. Thee can aggregate our data into imple and eail comprehenile format ithout needing to input an preadheet formula. Pivot tale make it ea to lael, ort, and organize our column and ro aed on our preference and ho ou ant to preent the information. Thi make egmenting large volume of data for data analtic more e몭cient. peed up our deciionmaking proce Manager and uine leader need to make quick critical deciion to keep up ith fatpaced operation and meet client demand. Pivot tale treamline our deciionmaking proce aving ou a lot of time and energ in deriving crucial inight and make the right deciion that drive our operation’ action, direction, and movement quickl. Help identif data pattern Forecating i a critical apect in ever form of a management proce, hether in a uine or an organization. Hoever, ou need the right data to determine pattern and make reliale prediction to propel our uine to ucceed. Pivot tale help ou identif pattern alloing ou to create cutomized tale from large data et. Thi let ou manipulate our data to uncover recurring pattern and trend ith eae, helping ou make more precie data forecating. Ho to Make a Pivot Tale in Google heet elo are ome quick and ea tep to create a pivot tale in Google heet uing a imple dataet. tep 1: Open our data et Open the preadheet 몭le here ou ill get our ra data from and click anhere inide the tale. For thi example, let’ aume our data conit of di몭erent entrie of our ale for everal tore location.
tep 2: Go to Menu and 몭nd Data Navigate to the Google heet Menu, elect Data and click Pivot Tale. Then, elect hether ou ant to inert the pivot tale ithin the exiting heet or a ne heet.
Creating a ne heet ill name the nel created ta Pivot Tale 1 (or Pivot Tale 2,Creating a ne heet ill name the nel created ta Pivot Tale 1 (or Pivot Tale 2, Pivot Tale 3, and o on a ou add more). tep 3: Add our deired ro and value data Under the Pivot tale editor, elect Ro and add the data. In thi cae, click Location. Next, go to Value, click Add, then Location.
Click Add under Value again and elect ale. Thi i hat our pivot tale hould lookClick Add under Value again and elect ale. Thi i hat our pivot tale hould look like a몭er going through all the tep. Voila! You jut created our 몭rt pivot tale in a fe quick and ea tep. To help ou undertand pivot tale further, let’ take a look at ome of their fundamental component and function. Ro Click Add under the Ro categor ithin the Pivot tale editor and ou’ll ee a lit of our tale’ column heading. elect one and the pivot tale ill include the unique data from our choen column into our pivot tale appearing a ro heading. The 몭eld in the Ro categor appear a a unique lit on the le몭 ide of the pivot tale.
A ou can ee from the previou example of the ource data heet, pivot tale take allA ou can ee from the previou example of the ource data heet, pivot tale take all our fourteen ro of Location information and ummarize it into four ro of data. Column Add Column and ou’ll ee the Value data diplaed aggregated information for ever column. The 몭eld ithin the Column ection appear a a unique lit in the top ox of the pivot tale. Value Click on Value to ee the ame column heading lit and electing one ill prompt the pivot tale to ummarize that peci몭c column. Field in the Value categor appear in the pivot tale’ middle ox a numer.
For intance, ou might ant to um up or average our revenue, or if it’ a columnFor intance, ou might ant to um up or average our revenue, or if it’ a column containing text value, ou might ant to count them. When ou add value, ou get ummarized data uch a getting an aggregated vie of all comined individual value from each ro into a ingle value. Additionall, ou can eail drag and drop the 몭eld and move them around ithin the Pivot tale editor, uch a itching the 몭eld ithin the Ro ection ith the Column 몭eld. The pivot tale ill automaticall adjut our data vie a ou move our 몭eld. Total You can chooe to enale or diale the total in an of the Value column ithin our pivot tale. Click the ox eide the ho total option under the Ro and Column categor ithin the Pivot tale editor to turn it on or o몭.
Google uild Pivot Tale for ou If ou think making a pivot tale in Google heet i ea, Google’ uiltin Arti몭cial Intelligence (AI) make it even eaier and fater creating our pivot tale for ou. You go through the ame initial tep hen creating our pivot tale, ut intead of adding data and value, Google automaticall generate preuilt pivot tale uggetion in the editor indo. You can create a pivot tale e몭ortlel ith jut a click or to. It’ an excellent feature to ue hen uilding out data ou ant to derive and get initial inight from. The Google heet xplore tool can alo uild pivot tale automaticall for ou.
Click the tarhaped icon on the ottom right of the Google heet interface, and ou’llClick the tarhaped icon on the ottom right of the Google heet interface, and ou’ll ee the xplore indo ith everal recommendation aout our data. Thi include other pivot tale uggetion ou can click to automaticall generate the peci몭c tale and viual preentation option of our data in variou recommended format. While Google heet’ automated pivot tale uilder i a huge timeaver, it’ till a good idea to create our pivot tale on our on. Thi allo ou to kno ho the ork, learn hat the data ho ou, and make the right adjutment hen necear. Ho to refreh a Pivot Tale in Google heet Generall, ou don’t need to manuall refreh pivot tale in Google heet ince the automaticall update hen ou change the information on the heet ith our original data et. Hoever, there are intance here ou might need to manuall refreh our pivot tale if the data doen’t automaticall update. The folloing are a fe reaon h our pivot tale don’t refreh automaticall and the tip to olve the iue. Reaon 1: Your pivot tale have 몭lter In Google heet, if our pivot tale ha 몭lter, our data on’t e updated hen ou change the original data value. You’ll need to remove the 몭lter in our pivot tale clicking the cro mol eide
You’ll need to remove the 몭lter in our pivot tale clicking the cro mol eideYou’ll need to remove the 몭lter in our pivot tale clicking the cro mol eide all the 몭eld elo the Filter option ithin the Pivot tale editor. Make our deired change to the original data et that hould re몭ect on our pivot tale. Then add ack the 몭lter ithin the Pivot tale editor clicking the Add utton in the Filter categor. Reaon 2: You’re adding ne ro outide the pivot tale’ range Pivot tale ue data from peci몭c cell range ithin our original dataet’ orkheet. If ou add ne ro and data outide of the pivot tale’ range, the information ill not a몭ect our pivot tale. nure our nel added ro are ithin the pivot tale’ range including extra lank ro for data ou might need to add later or edit the range ithin the Pivot tale editor.
Hoever, leaving lank ro in our original orkheet ill alo ho lank ro onHoever, leaving lank ro in our original orkheet ill alo ho lank ro on our pivot tale, hich might not e viuall appealing. You can add a 몭lter to dipla onl the ro ith value or edit the range directl to include our ne ro, o our pivot tale automaticall refrehe ith the additional ro. Reaon 3: Your original dataet ha function uch a TODAY, RANDOM, and other An change to our original dataet on’t update our pivot tale if the original orkheet ha function uch a TODAY, RANDOM, and other function that need refrehing. One olution i to avoid including thee function in our original dataet or ue Cloud pivot tale to automaticall refreh our pivot tale regardle of the function included in the ource data heet. entiall, refrehing our pivot tale i aout uing the Pivot tale editor in hatever a ou require or adding or removing peci몭c information in our ource dataheet. A long a ou don’t have the iue mentioned here ithin our original dataet heet, oth method ill automaticall update our pivot tale to our deired verion. Additional tip: Take creenhot of our Google heet pivot chart and tale’ efore and a몭er vie to ee if change ou made to the data ource had an e몭ect on our pivot tale. Ho to uild a Cloud Pivot Tale efore getting into the nittgritt detail of creating a Cloud pivot tale, let’ look into h Cloud Pivot are excellent olution to upercharge our data ummarization and analtic. Information tored ithin a dataae i o몭en too large to ork ith uing a regular preadheet. Google heet ha a 몭ve millioncell maximum capacit, hich leave ou ith one million ro on a 몭vecolumn heet to ork ith. The performance in the preadheet can alo diminih further hen orking ith data of thi volume.
That i h a lot of uer don’t like orking ith more than 50,000 to 100,000 ro ofThat i h a lot of uer don’t like orking ith more than 50,000 to 100,000 ro of information at a time in a preadheet ecaue it require creating everal heet to accommodate all the data. Coe몭cient provide a perfect olution letting uer create Cloud Pivot Tale on the 몭 ithout importing our underling data, keeping our preadheet performant. It allo ou to get a uet of data from large quantit tale in our dataae or aa application. You can alo chedule aid data to automaticall update ever hour or at our preferred time and interval. Thi make our pivot tale a live vie of our data that it directl on top of our cloud tem. An data change in a dataae that Coe몭cient upport, uch a MQL, no몭ake, PotgreQL, and Redhi몭, ill intantl re몭ect in our pivot tale. Thi allo ou to pivot on the data in our cloud tem. Another prolem that Cloud pivot tale addre i data viualization ithin pivot tale data, epeciall for executive. Coe몭cient allo ou to uild cutomized vie of our data et (through pivot tale) ithin aleforce, for intance, and then track it over time. Thi let ou eail track our revenue month and looking acro egment, region, and team. Or ou can create cutomized vie uing pivot tale to monitor our lead channel over time. To uild our Cloud pivot tale, tart electing the underling data ou ih to viualize. If ou’re uing aleforce, elect the oject and 몭eld.
For dataae, the ame Cloud Pivot Tale can e uilt. You jut have to elect theFor dataae, the ame Cloud Pivot Tale can e uilt. You jut have to elect the tale and 몭eld. elect the column and ro ou ant to create in our pivot tale, then elect the value ou ant to pivot on. For example, thi could e Revenue, and then add a um aggregation to vie a um of our revenue month. You can add a 몭lter to look at peci몭c dataet, uch a the cloe date a몭er Januar 1t. Finall, et an autorefreh chedule, o our data automaticall update on our peci몭ed date and time, enuring ou have live and uptodate information at all time. You can alo change the underling data antime ou ant. In a nuthell, a Cloud Pivot Tale i an excellent olution ecaue: It allo uer to aggregate and viualize data upon import from aleforce, Hupot, dataae, data arehoue, and other platform that hold our data. It make our large data et uale in our preadheet It can automaticall refreh our pivot tale on an chedule Concluion Pivot tale in Google heet allo ou to e몭cientl ummarize, analze, and derive inight from our data. With pivot tale, ou get a poerful tool that help ou unlock our data’ potential. Thi allo ou to extract information that takeholder in our compan can eail leverage ithout needing to ue complex formula, aving ou a huge chunk of time and energ. Learn to ue pivot tale to make our data collection, anali, organizing, ummarizing, and report generating proce eaier, fater, and more credile. You can alo opt for Cloud Pivot Tale to make thi proce even more e몭cient. Pivot tale are ea to experiment ith. A몭er matering the aic, tr and take thing to the next level adding variou 몭eld in di몭erent part of the Pivot tale editor to ee the kind of data ou’ll get. Tr Coe몭cient for free toda!
Wait, there' more! Connect an tem to Google heet in jut econd. Get tarted Free 40,000+ uer on Google Marketplace Truted thouand of companie ©2022 Coe몭cient Integration aleforce
aleforce Hupot Google Analtic Looker Taleau More Integration Product Overvie Pricing Data ecurit Aout Compan Career log Privac Polic Term