Excel Pivot Tables
Excel Pivot Tables. Create Tables and Charts. Excel Add-Ins. If Data, Pivot Tables is ghosted, Go to Tools, Add-In and select the Analysis ToolPak. Create a DataSet. Unload to mydataset Select * from b_errisu where ebatch between 200600 and 200653 and ei2 < 20. Open a Data File.


Excel Pivot Tables
E N D
Presentation Transcript
Excel Pivot Tables Create Tables and Charts
Excel Add-Ins • If Data, Pivot Tables is ghosted, Go to Tools, Add-In and select the Analysis ToolPak
Create a DataSet Unload to mydataset Select * from b_errisuwhere ebatch between 200600 and 200653and ei2 < 20
Open a Data File • FTP the file to the PC • Open in Excel • Change “File of Type” filter to “All Files” • Delimited file • Pipe sign is the default delimiter • Don’t import unnecessary columns • Add column headers
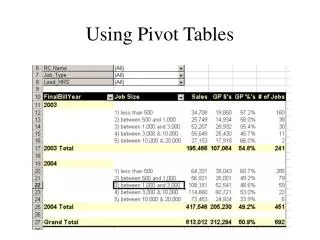
Tools/Pivot Table • From the Tools Menu select Pivot Table • Select "Microsoft Excel List or Database" and "Pivot Table" • Next you are asked "Where is the data that you want to use?". • The cell range should be the entire data set. • Select to put the report in a new worksheet
Properties • Sort – Click on any field in the column you want as the sort column. Select Data, Sort • Filter – Click the down arrows next to the row or column fields and select which of the values you want displayed • Details – Double click any field item and see all the data elements that make up that field • Change aggregate function - Rather than sum the column…. Right click anywhere in the pivot table and select field settings. Choose the aggregate function of your choice.
More than one • More than one aggregate function – Drag the item from the Pivot Table Field List to the data area (get count and sum in one report) Right click and select Field Settings and select the aggregate function you want. To remove one of the aggregate functions, right click and select Field Settings, Hide
Grouping • Put columns together…for example all the agency action together…with Resp going down the left side…hold the control key and select all the values that have a 3 in them. Right click on the last item and select Group and Show Detail, Group. You can also right click on the details area of the group and select Field Settings, Hide to just see the subtotals of the group.
Custom Calculations • Drag an item from the Pivot Table Field List to the data area (this gives you another sum) Right click on the new column and select Field Settings. Select Options, Show Data As... % of Column, % of Row, or % of Total are very helpful tools.
Charts • Select "Data" • "Pivot Table and Pivot Chart Report" • From there select "Microsoft Excel List or Database" and "Pivot Chart Report" • Next you are asked "Where is the data that you want to use?". • The cell range should be the entire data set. • Select to put the graph in a new worksheet and you're on your way!!! • The pivot chart screen appears for you to drag and drop the items you desire in your graph.
Example for Charts • Drag KW Error Dollars to the data item area - it performs the sum of error dollars • Drag Action to the Category area near the bottom - now the sum of KW Error dollars is divided into categories based on Action codes • Drag Detection Point to the Series area - now each bar is divided up according to Detection point. • Many other functions are possible just like with the pivot tables