Download
1 / 2
20 likes | 27 Views
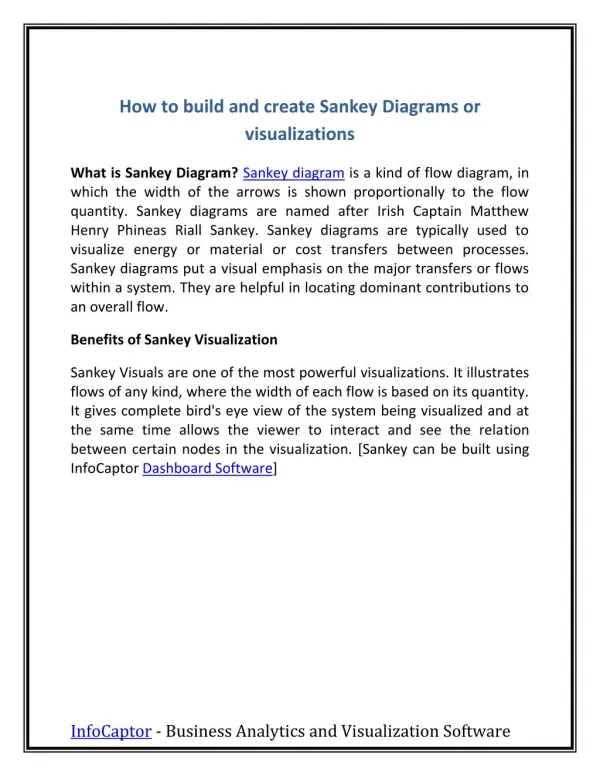
A Sankey diagram is a powerful visualization that provides an overview of the flows in a system, such as energy or materials, or in advertising, the customer journey.<br>

E N D
What is a Sankey Diagram? Visualizing Data Stories with Sankey Diagram
What is a Sankey Diagram • A Sankey diagram is a powerful visualization that provides an overview of the flows in a system, such as energy or materials, or in advertising, the customer journey. • As each flow has a varying height depending on its quantity, analysts can easily determine the most prominent contributions. This type of segmentation analysis makes it easy to draw conclusions from data. More: https://ppcexpo.com/blog/visualizing-customer-journey-with-sankey-diagram