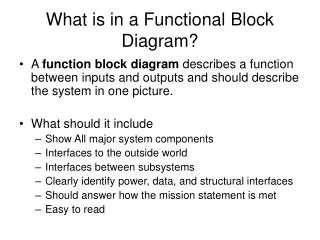
1 / 1

Analyzing DDT Concentration Distribution Diagram

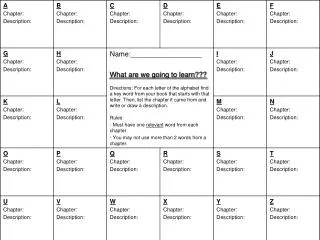
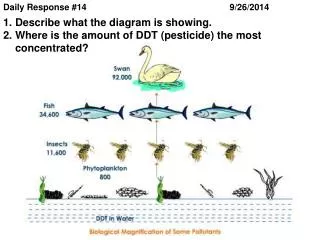
This diagram illustrates the distribution of DDT pesticide concentration. The highest concentration of DDT is found in which part of the diagram? Take a close look to identify the most concentrated area.

wayne-neal
Download Presentation

Analyzing DDT Concentration Distribution Diagram

An Image/Link below is provided (as is) to download presentation Download Policy: Content on the Website is provided to you AS IS for your information and personal use and may not be sold / licensed / shared on other websites without getting consent from its author. Content is provided to you AS IS for your information and personal use only. Download presentation by click this link. While downloading, if for some reason you are not able to download a presentation, the publisher may have deleted the file from their server. During download, if you can't get a presentation, the file might be deleted by the publisher.

E N D

Presentation Transcript


  1. Daily Response #14 9/26/2014 • Describe what the diagram is showing. • Where is the amount of DDT (pesticide) the most concentrated?

More Related