Download
1 / 19
190 likes | 471 Views
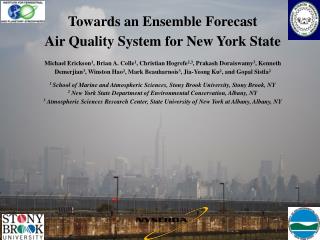
Moving Towards an Ensemble and High-Resolution Air Quality Forecast Guidance System for New York State. C. Hogrefe 1,2 , P. Doraiswamy 2 , B. Colle 3 , W. Hao 1 , J.-Y. Ku 1 , and G. Sistla 1 1 New York State Department of Environmental Conservation, Albany, NY

E N D
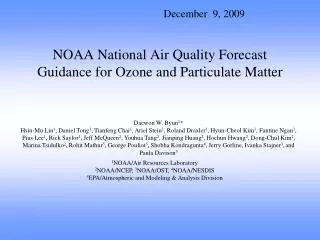
Moving Towards an Ensemble and High-Resolution Air Quality Forecast Guidance System for New York State C. Hogrefe1,2, P. Doraiswamy2, B. Colle3, W. Hao1, J.-Y. Ku1, and G. Sistla1 1New York State Department of Environmental Conservation, Albany, NY 2Atmospheric Sciences Research Center, University at Albany, Albany, NY 3School of Marine and Atmospheric Sciences, Stony Brook University, Stony Brook, NY 2008 National Air Quality Conference, April 8, 2008 The work presented here was performed by the New York State Department of Environmental Conservation with partial support from the U.S. EPA under cooperative agreement CR83228001. The views expressed in this paper do not necessarily reflect the views or policies of the New York State Department of Environmental Conservation or those of the U.S. EPA.
Model-Based Air Quality Forecasting at NYSDEC • Established in 2004 as partnership between NYSDEC, NOAA and EPA to apply and evaluate a state-of-science photochemical modeling system on an ongoing basis with special emphasis on PM2.5 predictions over New York State • Aimed at assessing the potential usefulness of grid-based photochemical models to provide O3 and PM2.5 guidance products for NYS air quality forecasters • Complements the NOAA/EPA national air quality forecasting activities • Funding from EPA through cooperative agreement with NYSDEC • Project period: January 2005 – December 2008
WRF(ETA)/CMAQ Modeling System Setup • Meteorology/Emissions: NCEP/NWS48-hr ETA (or WRF) forecasts initialized at 12:00 UTC and 2002/2004/2005 emission inventory • Photochemical Modeling: Standard release of CMAQ to simulate hourly gridded concentration fields for 50+ gas phase and aerosol species • Horizontal resolution: 12 km • Vertical resolution: 22 layers, lowest layer ~35 m • Initial Conditions: Previous Day’s Simulation • Near-Realtime Modeling: Next-Day forecast guidance posted ~ 2 pm EST • Simulation Periods: • June 2005 – present
Experiences with Model Performance To Date • The WRF/CMAQ system generally captures the timing of pollutant build-up and removal events • For ozone, CMAQ has a tendency to overestimate low concentrations and underestimate high concentrations • For PM2.5, CMAQ strongly overpredicts concentrations for the NYC metro area while there is a tendency to underpredict PM2.5 in other areas of NYS
Despite the strong overprediction, CMAQ generally captures the timing of PM2.5 build-up and removal events as well as seasonal fluctuations 24-hr Average PM2.5; June 2005 – December 2006; NYC Metro • Strong correlation, but a large number of false alarms • CMAQ strongly and systematically overestimates observed PM2.5 concentrations in this region • On some days, overprediction of “region concentration” may be driven by a few grid cells
Fractional Bias (FB) for 24-hr average total PM2.5 predictions at all FRM monitors located in New York State calculated over all available days 2004 - 2005 • PM2.5 overprediction is largely confined to the NYC metro area • There is a tendency to underpredict PM2.5 in rural areas of NYS
New York’s Routine Air Quality Forecasting Program • NYSDEC issues daily forecasts of the Air Quality Index (AQI) to the public for eight “air quality regions” in New York State • The AQI predicted for a given air quality region is based on predictions of both O3 and PM2.5 for that region: • Both O3 and PM2.5 concentrations are predicted for each of the eight regions • Predicted concentrations are converted to the AQI • The AQI predicted for a given region is the greater of the O3 AQI and PM2.5 AQI • These NYSDEC routine AQI forecasts are based on measured concentrations, climatology, weather forecasts, and expert judgment • CMAQ forecasts are provided as additional guidance input
http://www.dec.ny.gov/cfmx/extapps/aqi/aqi_forecast.cfm .. .and CMAQ Simulations CMAQ: ftp://ftp.dec.state.ny.us/dar/air_research/aqf/forecast/today/index.html New York’s Routine Air Quality Forecasts ...
Additional CMAQ Guidance Products: Predicted Hourly Evolution of PM2.5
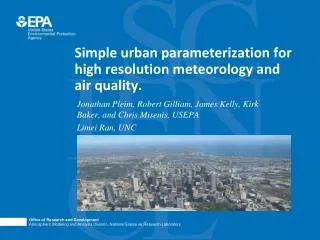
Planned Developments • Refinement and implementation of integration methods to generate automated post-processed CMAQ model guidance incorporating ground-based (Airnow, AQS, STN, CASTNet, etc.) and remote sensing data (e.g. AOD through 3DAQS) • Multi-model simulations building on the meteorological Short-Range Ensemble Forecast (SREF) system maintained by SUNY – Stony Brook (SUNY-SB) • High-resolution modeling for NYC area
Additional CMAQ Guidance Products:Post-Processed CMAQ PM2.5 Concentrations to Account for Known Model Performance Issues
Example Comparison of MODIS AOD-V5 vs. CMAQ PM2.5 Average 9 – 11 am Summer, Albany Summer, IS52, Bronx Integration of AOD from projects like 3DAQS needs to be explored on a monitor-by-monitor and season-by-season basis Fall, Albany Fall, IS52, Bronx
Planned Air Quality Ensemble Forecast System (AQEFS) AQEFS will include variability from both meteorological ensembles (SUNY-SB SREF) and different photochemical modeling systems (CMAQ, CAMx) and possibly be expanded to include uncertainties in emission estimates
Example Multi-Model Comparison Air Quality Forecasts 8-hr Daily Maximum Ozone, September 7, 2007 NYSDEC WRF/CMAQ 12 km SUNY-SB SREF MM5 / CMAQ 12 km
SUNY-SB SREF MM5/CMAQ 36 km SUNY-SB SREF MM5 / CMAQ 12 km SUNY-SB SREF MM5 / CMAQ 4 km Example Multi-Model Comparison Air Quality Forecasts Daily Average PM2.5, September 21, 2007 NYSDEC WRF/CMAQ 12 km
Example of Multi-Model Air Quality Simulations: 24-hr Average Observed and Simulated PM2.5 9/2 – 9/24 2007 IS52, Bronx IS143, W 182nd St • The use of multiple air quality model forecasts provides the opportunity to provide and evaluate a range of predicted concentrations • By adding additional ensemble members (CMAQ driven by different meteorological fields from the SUNY-SB SREF and the CAMx system utilized by SUNY-Albany), the utility of ensemble mean forecasts or bias-corrected ensemble mean forecasts can be assessed
Initial Analysis of the Effect of Grid Resolution on Simulated 24-hr Average PM2.5 Concentrations • Analyzed September 1 – 24, 2007 and January 15 – February 12, 2008 CMAQ simulations performed at 36 km, 12 km and 4 km driven by SUNY-SB MM5 fields; only winter results shown here • For the analysis, defined a domain common to all grids, spanning 9 x 9 36 km cells, 27 x 27 12 km grids, and 81 x 81 4 km grids • To date, focused on comparing model simulations at different resolution to each other: what do we learn about PM2.5 subgrid scale variability (i.e. 12 km within 36 km, 4 km within 36 km, 4 km within 12 km)? • Example: calculated standard deviation of 9 4km grid cells within 12 km grid
m/s μg/m3 °C g/s Within-Grid Variability – 4 km within 12 km January 13 – February 12, 2008 PM2.5 Concentrations Temperature Wind Speed PM2.5 Emissions • the effect of finer grid resolution on simulated PM2.5 concentrations in this region appears to be driven more by the effect of grid resolution on emissions than by its effect on meteorological fields • Perform future work with a high-resolution (1.33 km) urban WRF / CMAQ modeling system
Summary of Future Work • Implement Air Quality Ensemble Forecast System (AQEFS): • Continue to operate the NYSDEC WRF/CMAQ system • Add air quality forecasts performed by ASRC/SUNY Albany using the ETA/CAMx system to the analysis • Routinely use two selected members of the SUNY-SB 12 km SREF system to drive air quality forecasts • For two one-month time periods, perform air quality simulations using meteorological fields from all 13 SREF members • Set up urban WRF to generate 1.33 km meteorological fields as input for high resolution CMAQ simulations • Provide information from these simulations as additional guidance products to air quality forecasters • Refinement and implementation of integration methods to generate automated post-processed CMAQ model guidance incorporating ground-based (Airnow, AQS, STN, CASTNet, etc.) and remote sensing data (e.g. AOD through 3DAQS)