Download
1 / 56
560 likes | 658 Views
Discover the agricultural landscape of New York State, featuring statistics on population, land use, top commodities, dairy production, cattle farming, maple syrup, poultry, hogs, field crops, and fruit crops. Explore the state’s farming diversity and economic contributions in various sectors.

E N D
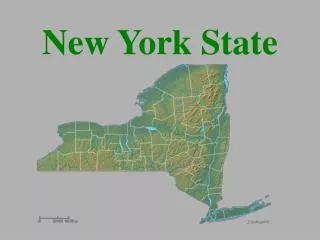
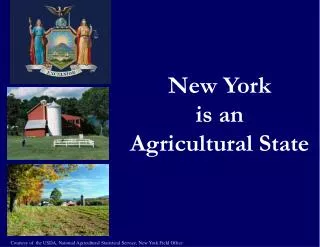
New York is an Agricultural State Courtesy of the USDA, National Agricultural Statistical Service, New York Field Office
Population & Land Use Land Area (sq miles)Total: 47,211 0.6% 42% 58% 99.4% Courtesy of the USDA, National Agricultural Statistical Service, New York Field Office
North Country FactsPopulation Distribution: Courtesy of the USDA, National Agricultural Statistical Service, New York Field Office
NUMBER OF FARMS Courtesy of the USDA, National Agricultural Statistical Service, New York Field Office
New York’s Top 5 Commodities, 2008 Courtesy of the USDA, National Agricultural Statistical Service, New York Field Office
Cash Receipts by CommodityNew York, 2008(Millions of Dollars) Courtesy of the USDA, National Agricultural Statistical Service, New York Field Office
Dairy Courtesy of the USDA, National Agricultural Statistical Service, New York Field Office
Number of New York Dairy Farms Courtesy of the USDA, National Agricultural Statistical Service, New York Field Office
Number of Dairy CowsJanuary 1, New York Courtesy of the USDA, National Agricultural Statistical Service, New York Field Office
Dairy Cows Per Farm, New York Courtesy of the USDA, National Agricultural Statistical Service, New York Field Office
Annual Milk Production per Cow,New York Courtesy of the USDA, National Agricultural Statistical Service, New York Field Office
Total Milk Production,New York Courtesy of the USDA, National Agricultural Statistical Service, New York Field Office
Annual Average Milk PriceNew York Courtesy of the USDA, National Agricultural Statistical Service, New York Field Office
Annual Milk Cow Value, New York(replacements) Courtesy of the USDA, National Agricultural Statistical Service, New York Field Office
Cheese Production, New York Courtesy of the USDA, National Agricultural Statistical Service, New York Field Office
Cattle Picture courtesy of www.nnyaggdev.org Courtesy of the USDA, National Agricultural Statistical Service, New York Field Office
Cattle and Calves on Farms,New York Courtesy of the USDA, National Agricultural Statistical Service, New York Field Office
Cattle on Feed, Jan. 1, New York Courtesy of the USDA, National Agricultural Statistical Service, New York Field Office
Number of Farms with Cattle,New York Courtesy of the USDA, National Agricultural Statistical Service, New York Field Office
Beef Cow Farms, New York Courtesy of the USDA, National Agricultural Statistical Service, New York Field Office
Average Value per Head of all Cattle and Calves, Jan. 1, New York Courtesy of the USDA, National Agricultural Statistical Service, New York Field Office
Sheep on Farms, New York Courtesy of the USDA, National Agricultural Statistical Service, New York Field Office
New York Maple Syrup Production Courtesy of the USDA, National Agricultural Statistical Service, New York Field Office
\ Honey Production, New York • \ Courtesy of the USDA, National Agricultural Statistical Service, New York Field Office
Maple Syrup Year
Poultry Courtesy of the USDA, National Agricultural Statistical Service, New York Field Office
Chickens, December 1, New York Courtesy of the USDA, National Agricultural Statistical Service, New York Field Office
New York Egg Production Courtesy of the USDA, National Agricultural Statistical Service, New York Field Office
HOGS Courtesy of the USDA, National Agricultural Statistical Service, New York Field Office Image from http://search.live.com/images
Hogs & PigsDecember 1st Inventory Courtesy of the USDA, National Agricultural Statistical Service, New York Field Office
FIELD CROPS Graphic from http://www.yip.org/corn/ Graphic from http://www.hort.purdue.edu
Corn Acres Harvested,New York Courtesy of the USDA, National Agricultural Statistical Service, New York Field Office
Wheat Acres Harvested, New York Graphic from http://www.oznet.ksu.edu/ Courtesy of the USDA, National Agricultural Statistical Service, New York Field Office
Potato Acres Harvested, New York Graphic from http://www.vegsoc.org Courtesy of the USDA, National Agricultural Statistical Service, New York Field Office
Soybean Acres Harvested, New York Courtesy of the USDA, National Agricultural Statistical Service, New York Field Office
Average Prices for Selected Crops, New York Courtesy of the USDA, National Agricultural Statistical Service, New York Field Office
New York Hay:Marketing Year Average Price Courtesy of the USDA, National Agricultural Statistical Service, New York Field Office
FRUIT CROPS Graphic from http://www.bbc.co.uk
New York 2010 Fruit Production Ranks High Across the Nation • Grapes • 1 California • 2 Washington • 3 New York • 4 Pennsylvania • 5 Oregon • Pears • 1 Washington • 2 California • 3 Oregon • 4 New York • 5 Pennsylvania • Apples • 1 Washington • 2 New York • 3 Michigan • 4 Pennsylvania • 5 California • Tart Cherries • 1 Michigan • 2 Utah • 3 Washington • 4 New York • 5 Wisconsin Courtesy of the USDA, National Agricultural Statistical Service, New York Field Office
NEW YORK FRUIT 2010 Total Value of Production$332 Million Courtesy of the USDA, National Agricultural Statistical Service, New York Field Office
New York GrapesAverage Price per Ton Courtesy of the USDA, National Agricultural Statistical Service, New York Field Office
MAJOR NEW YORK GRAPE VARIETIES 2010 Courtesy of the USDA, National Agricultural Statistical Service, New York Field Office
New YorkGrown Grapes Processed 1/ Not published to avoid disclosure of individual operations. Included in other varieties Courtesy of the USDA, National Agricultural Statistical Service, New York Field Office
UTILIZATION OF 2010 NEW YORK GRAPE PRODUCTION Fresh 2% 4,000 tons Courtesy of the USDA, National Agricultural Statistical Service, New York Field Office
New York ranks 2nd nationally with receipts worth about $209 million in 2009. New York’s leading varieties are McIntosh, Empire, Red Delicious, Cortland, Golden Delicious, and Rome. Courtesy of the USDA, National Agricultural Statistical Service, New York Field Office
VEGETABLES Graphic from http://www.Tinkersgarden.com Courtesy of the USDA, National Agricultural Statistical Service, New York Field Office
Nationally, New York Ranks 5thin the Value of PrincipalFresh Market Vegetables, 2008 State 1. California 2. Florida 3. Arizona 4. Georgia 5. New York 6. Washington 7. Texas Million Dollars $5,250 $1,552 $ 730 $ 456 $ 406 $ 261 $ 245 Courtesy of the USDA, National Agricultural Statistical Service, New York Field Office
Fresh Market Vegetables, 2009Principle Crops by Value of Production Courtesy of the USDA, National Agricultural Statistical Service, New York Field Office
Total Value of Onions Courtesy of the USDA, National Agricultural Statistical Service, New York Field Office
New York Cabbage Ranks #1for Value Production, 2008 Courtesy of the USDA, National Agricultural Statistical Service, New York Field Office