Download
1 / 30
300 likes | 453 Views
December 9, 2009. NOAA National Air Quality Forecast Guidance for Ozone and Particulate Matter. Daewon W. Byun 1 *

E N D
December 9, 2009 NOAA National Air Quality Forecast Guidance for Ozone and Particulate Matter Daewon W. Byun1* Hsin-Mu Lin1, Daniel Tong1, Tianfeng Chai1, Ariel Stein1, Roland Draxler1, Hyun-Cheol Kim1, Fantine Ngan1, Pius Lee1, Rick Saylor1, Jeff McQueen2, Youhua Tang2, Jianping Huang2, Hochun Hwang2, Dong-Chul Kim2, Marina Tsidulko2, Rohit Mathur5, George Pouliot5, Shobha Kondragunta4, Jerry Gorline, Ivanka Stajner3,and Paula Davison3 1NOAA/Air Resources Laboratory 2NOAA/NCEP, 3NOAA/OST, 4NOAA/NESDIS 5EPA/Atmospheric and Modeling & Analysis Division
Outline • Overview of NOAA National Air Quality Forecasting System • Performance of ozone guidance • Performance of experimental PM forecasting • FY10 & future developmental plans
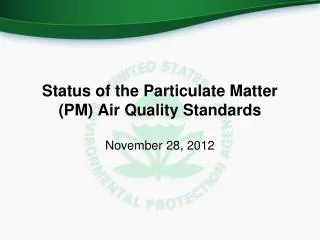
National Air Quality Forecast Capability Improve model bases for AQ alerts Provide AQ information for people at risk 2005: O3 2010: O3 AK,HI 6 2007: O3,& smoke 2010: smoke • FY09 Prediction Capabilities: • Operations at 12-km resolution: Ozone, expanded from EUS to CONUS, 9/07 Smoke implemented over CONUS, 3/07 • Experimentaltesting: • Ozone upgrades • Smoke predictions over Alaska and Hawaii • Developmentaltesting: • Ozone over AK and HI • Components for particulate matter (PM) forecasts 2009: smoke • Near-term Operational Targets: • Ozone, smoke coverage extended Nationwide • When NCEP is ready for CONUS 4-km NAM meteorology (NAM-B at 4-km) • High resolution AQ prediction (4km) for CONUS • Longer range: • Quantitative PM2.5 prediction • Extend air quality forecast range to 48-72 hours • Include broader range of significant pollutants 3
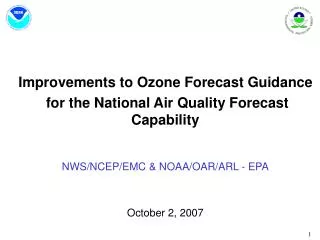
Eastern US “1x” Domain FY 04-05 268 grid cells 442 grid cells NAM-CMAQ NAQFC Current ConfigurationOzone production & PM experimental http://www.weather.gov/aq Data and Modeling Systems CONUS “5x” Domain • Emissions: • EPA CEM anthropogenic inventories • 2005 base year projected to current year w/ EGU • BEIS V3 Biogenic Emissions • Met Model: • North American Model (NMM) • Non-hydrostatic Multi-scale Model (NMM) • 12 km 60 Levels • AQ Model: • EPA Community Model For Air Quality • CMAQ V4.6: 12 km/L22 CONUS Domain • Oper: CB-IV gas-phase • Exper/Dev: CB05/ Aero-4 aerosols • Output available on National Digital Guidance Database • 48 hour forecasts from 06/12 UTC Cycles 142 Eastern US “3x” Domain FY 06-07
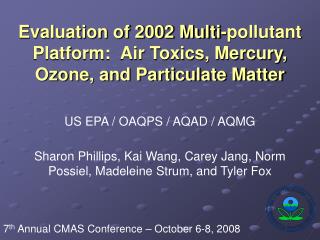
Jerry Gorline Number of observed values higher than 76 ppb threshold 1200 UTC8-h ozone, by region Performance of O3 forecast Fewer cases in the East in 2009, compared to 2007 and 2008 (except for CA)
Jerry Gorline 8-h ozone bias, three-year comparisonAugust 2007, 2008, 2009CONUS, 1200 UTC cycle (48 hour forecast mean) experimental: slightly higher bias in 2009 2007: CBIV 2008: CB05 2009: CB05
NCEP Air Quality Forecast 2009 Verification (1 hr Max ozone for Day 2 for June, July, Aug) Jeff McQueen CB-IV CB-05 *** CB-05 mechanism is used for improving SOA, etc… for CMAQ4.7 RMSE BIAS East West - Increasing Bias trend as Summer progressed for Eastern U.S. Max temp bias improves slightly by August but ozone errors increased in East U.S.
1/1/-9/30 2009 Northeast US Rock Mountain Upper Midwest Sept. Pacific Coast Region Lower Midwest Southeast US
Interim summary of NAQFS O3 • High O3 events decreased considerably 2007 2008 2009 except for CA. • Also, CB05 high bias much more serious than CB-IV. CB05 high bias increased in 2009 compared to 2008 • High bias accumulates in Eastern US • Would 2009 economic downturn cause higher model bias due to wrong emission projection (e.g., Bill Ryan)? • Causes of CB05 high bias over CB-IV may be ??? • Addition of terpene emissions make more radicals available affecting formation of PAN species • NOY recycling (additional NOx source) • Inadequate removal processes (dry & aqueous deposition) • Anything else (such as interaction of gas-, aerosol, and heterogeneous reactions)?
How dose PM behaves? Seasonal variation of activity8-h ozone vs. 1-h aerosols (June 2008 to August 2009)Threshold: 76 ppb (ozone) 35 ug/m3 (aerosols) Aerosols are active in both winter and summer
2009 AQFS Performance –Developmental PM2.5, US (CB05/Aero4, Daily Max) 1/1/-9/30 2009 RMSE Normalized Mean Error OBS mean CMAQ mean Correlation (hourly) Correlation (daily max) Mean Bias Normalized Mean Bias
1/1/-9/30 2009 Northeast US Rock Mountain Upper Midwest Pacific Coast Region Lower Midwest Southeast US
Regional performance of aerosolsFraction Correct (FC)Jan 2008 to Sept 2009, 35 ug/m3 1/1/-9/30 2009 lower bias in winter 2009 compared to winter 2008, except PC region CB05 AERO-4
Forecast and Obs (1 hr avg) for Oct 31-Nov 30, 2009(48 hour mean forecast vs. Obs) Jerry Gorline PC region show not much bias in Nov. 2009, but UM shows high bias (~ 10 ug/m3) UM PC
Rick Saylor Preliminary SEARCH Data – Jefferson St., Atlanta, GA Rain ?
Rick Saylor Preliminary SEARCH Data – Yorkville, GA Intermittent Rain Comparison with AQFS model speciation output underway…..
Ariel Stein Investigation of model bias: Study sulfate production by different mechanisms 2004 ICARRT Gas phase chemistry: CB-IV, CB05, SAPRC99, CB05Cloud processes & Aqueous chemistryScavenging and wet depositionModel domain Eastern USHorizontal: 12-km resolutionVertical: variable thickness 22 layersStudy period: 14-23 July, 2004 (ICARRT case)
Differences in Sulfate Production (by mechanism) Backward trajectories over source areas Total similar but CB-IV mostly from H2O2 & MHP CB05 & SAPRC show contributions from PE/MN & PAA Variable & away from large sources
Ariel Stein H2O2 CB-IV formation rate 60% higher than CB05 and SAPRC-99. CB05 produces more new HO2 than SAPRC-99 obs MHP from CB-IV seriously over estimated Methylhydroperoxide CB-IV: XO2 + HO2 MHP CB05: MEO2 +HO2 MEPX MEPX + OH prod MEPX + hn prod HCO3 + HO2 MEPX SAPRC99: C_O2 + HO2 COOH COOH + OH prod COOH + hn prod MEPX from CB05 & COOH from SAPRC well predicted… but
Peroxyacetic acid CBIV: PACD well predicted PA + HO2 prod + 0.21 PACD SAPRC-99:PAA overpredicted PA + HO2 prod + 0.75 PAA CB05:PACD overpredicted PA + HO2 prod + 0.8 PACD PACD + OH PA CXO3 + HO2 prod +0.8 PACD
Hsin-Mu Lin Ariel Stein On-going work Include Fire Emissions: Link NESDIS HMS/USDA Bluesky/ARL HYSPLIT input HMS data & Bluesky (as in HYSPLIT) NCEP Meteorological Model (NAM) EPA Emissions Inventory PREMAQ 1st step: Fire event process Emissions (CMAQ ready data) Met. Data (CMAQ ready data) 2nd step: Plume rise process Fire Emission: EPA inv + Bluesky (CMAQ ready data) Emission due to the Fire CMAQ Model Chemical-Transport Computation
Hsin-Mu Lin HMS Case for 2009-05-09 1200Z runThe plot show the difference of PM2.5 between the CMAQ with and without Smoke ProductComparison with the satellite fire detection and HYSPLIT PM product are also provided 30 m/sec
Youhwa Tang PM2.5 bias to observation (small circles) with & without fire emissions (* climatology fire emission is removed from the HMS/BlueSky/HYSPLIT emissions) Case for 2009-08-02 CMAQ PM2.5 Difference (HMS – PARA) in mg/m3 Circles: Bias with episodic fire (but no climatological) emissions CMAQ (with fire E) - OBS Bias here did not improve with the addition of fire emissions (good model prediction if color between circles and background cells are close) Improved with fire emissions Without fire emissions: CMAQ PM2.5 in mg/m3 Circles: Bias without episodic (but with climatological) fire emissions CMAQ - OBS in mg/m3 (Colors for circles and background Have no relations)
On-going work to include Wind-Blown Dust Emissions Daniel Tong Natural desert sources (Chihuahua desert) Natural dust not accounted for yet in NAQFS Major Dust Emission Sources Anthropogenic sources Dust emissions most active in Spring Annual Emissions ~ 3 Tg/yr (Road dust, mining, construction, tilting, etc) Cropland sources EPA’s NEI includes anthropogenic dust sources Modeling Natural Dust requires • Owen’s flux equation • Threshold friction velocities from field and wind tunnel measurements; • USGS land use and soil data; • Vegetation growth and near source enhanced deposition;
Missing Sources in Mexico (Source: Rivera et al., 2006) (April 2003 Case Study) Testing algorithms -- Comparison with IMPROVE & MODIS Improved, but not enough. Daniel Tong MODIS MODEL
Ho-Chun Hwang Dong-Chul Kim NCEP FY10 Plans: Global-Regional Linkages • CMAQ Lateral Boundary Condition Impact Study : • GOCART Global model w/ full aerosols (dust, biomass) coupled to CMAQ • Implement Real-time Global Dust Forecasts: • Couple w/ para GFS fields to drive GOCART • GFS T382-GOCART 1° real-time runs to 60 hours w/ 1 degree surface cover • Develop Chemical Data Assimilation & global aerosol interactions : • GOCART aerosol analyses coupled to GSI & GFS/CFS radiation • Online NEMS GOCART module • Adding AOD tracer to GSI • Prefer on-line so forward guess at same time
Interim summary of NAQFS Experimental PM2.5 • Winter high bias and summer low bias in PM2.5 mass & regional differences not well understood • NH3 emission issues? • NOy budget including dry & aqueous depositions? • PM speciation information needed • Better understanding of dependence of PM speciation to gas-phase mechanism necessary • gas, aerosol, heterogeneous reaction interactions • Develop methods (data/algorithms) for including intermittent emissions from forest fire, wind-driven dust, (volcanic ashes, etc & BCs) • Link with global models