Economic Terms
500 likes | 1.21k Views
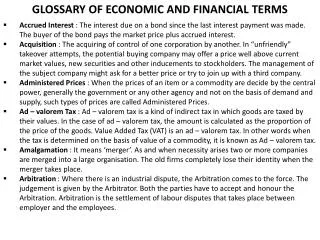
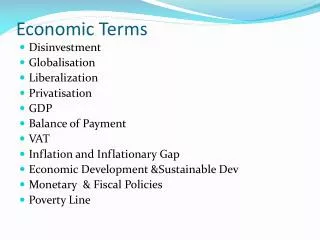
Economic Terms. Disinvestment Globalisation Liberalization Privatisation GDP Balance of Payment VAT Inflation and Inflationary Gap Economic Development &Sustainable Dev Monetary & Fiscal Policies Poverty Line. Important Questions?. Q1. Is Inexpensive labor a Blessing or a Curse?

Economic Terms
E N D
Presentation Transcript
Economic Terms • Disinvestment • Globalisation • Liberalization • Privatisation • GDP • Balance of Payment • VAT • Inflation and Inflationary Gap • Economic Development &Sustainable Dev • Monetary & Fiscal Policies • Poverty Line
Important Questions? • Q1. Is Inexpensive labor a Blessing or a Curse? • Q2. Highlight the major areas where Govt Intervention is essential to facilitate Economic Growth? • Q3.The case for Privatization is essentially built around the poor performance of the public sector. Do you agree? Elucidate. • Q4. What are the major global challenges which Indian economy is facing? Discuss in detail. • Q5. Why HDI is considered to be a very important tool for economic growth? • Q6. WTO highlighting on TRIPS AND TRIMS? • Q7. FDI’s & FII’s Inflows in India?
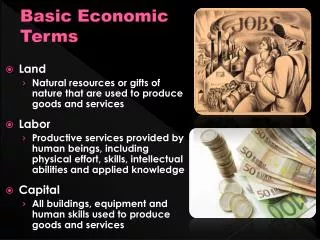
Definition • Totality of economic factors, such as employment, income, inflation, interest rates, productivity, and wealth, that influence the buying behavior of consumers and firms • The economic environment comprises of: • Income and wealth: Income in an economy is measured by GDP, GNP and per capita income. High values of these factors show a progressive economic environment. • · Employment levels: High employment represents a positive picture of the economy. However, there are many forms of unemployment, including partial employment and disguised unemployment. • · Productivity:This is the output generated from a given amount of inputs. High levels of productivity support the economic environment.
Classifications of the Economic Environment • Microeconomic environment: It includes the economic environment of a particular industry, firm or household and is primarily concerned with price determination of individual factors. The main consideration from a microeconomic perspective is the efficient allocation of resources. This is necessary to maximize total output. • Macroeconomic environment: It includes all the economic factors in totality. The main consideration here is the determination of the levels of income and employment in the economy.
Factors Affecting the Economic Environment • Inflation and deflation: Inflationary and deflationary pressures alter the purchasing power of money. This has a direct impact on consumer spending, business investment, employment rates, government programs and tax policies. • Interest rates: Interest rates determine the cost of borrowing and the flow of money towards businesses. • Exchange rates: This impacts the price of imports, the profits made by exporters and investors and employment levels (also through the impact on the tourism industry). • Monetary and fiscal policy: This helps in attaining full employment, price stability and economic growth.
The economic environment is also influenced by various such as : 1. Political 2.Social and 3.Technological factors These include a change in government and the development of new technology and business tools.
Classification of Economies • Economies of countries can be classified based on parameters: 1. Ownership of means of production a)capitalist economy b)socialist economy c) Mixed economy 2. Levels of economic development a)Developing countries b)Developed countries
Capitalism is an economic system characterized by private ownership of productive goods and services. Socialism is an economic and political system in which private property is abolished and the means of production (i.e., capital and land) are collectively owned and operated by the state. Mixed economy, in which some of the means of production are owned by the government while some is held by private individuals.
The World Bank relies on income levels to classify countries into these two categories. GDP is the value of the total final output of all goods and services produced in a single year within a country's boundaries. GNP is GDP plus incomes received by residents from abroad minus incomes claimed by nonresidents. Inflation is a general price rise in prices across the economy.It is different from the rise in price of a particular good or service. The amount of inflation in the economy depends on the level of monetary demand in the economy, and amount of demand in the economy relative to available supply of goods and services. WPI is an index of the prices of products and services consumers buy. The interest rate is the rate charged or paid for the use of money, normally expressed as a percentage.
ECONOMIC INDICATORS • An economic indicator is simply any economic statistic, such as the unemployment rate, GDP, or the inflation rate, which indicate how well the economy is doing and how well the economy is going to do in the future. As shown in the article "How Markets Use Information To Set Prices" investors use all the information at their disposal to make decisions. If a set of economic indicators suggest that the economy is going to do better or worse in the future than they had previously expected, they may decide to change their investing strategy.
What Does Economic Indicator Mean? • A piece of economic data, usually of macroeconomic scale, that is used by investors to interpret current or future investment possibilities and judge the overall health of an economy. Economic indicators can potentially be anything the investor chooses, but specific pieces of data released by government and non-profit organizations have become widely followed - these include:- The Consumer Price Index (CPI)- Gross Domestic Product (GDP)- Unemployment figures- The price of crude oil
Investopedia explains Economic Indicator • An economic indicator is only useful if one interprets it correctly. History has shown strong correlations between economic growth (as measured by GDP) and corporate profit growth. However, determining whether a specific company will grow its earnings based on one indicator is nearly impossible. Indicators give us signs along the road, but the best investors will utilize many economic indicators, looking for patterns and verifications within different sets of data. Most economic indicators have a specific schedule for release, allowing investors to prepare for and plan on seeing certain information at certain times of the month and year
The Effectiveness of Economic Indicators • Over time, economic indicators have greatly increased the level of sophistication in economic forecasting and the analysis of business performance. The usefulness of these indicators, however, depends as much on the user's knowledge of their limitations as on the indicators themselves. Indicators provide only averages, and as such record past performance. As some economists have pointed out, applying indicators to predict future developments requires an understanding that history never repeats itself exactly.
CATEGORIES OF ECONOMIC INDICATORS • There are three major attributes: 1. Relation to the Business Cycle / Economy Economic Indicators can have one of three different relationships to the economy: • Procyclic: A procyclic (or procyclical) economic indicator is one that moves in the same direction as the economy. So if the economy is doing well, this number is usually increasing, whereas if we're in a recession this indicator is decreasing. The Gross Domestic Product (GDP) is an example of a procyclic economic indicator. • Countercyclic: A countercyclic (or countercyclical) economic indicator is one that moves in the opposite direction as the economy. The unemployment rate gets larger as the economy gets worse so it is a countercyclic economic indicator. • Acyclic: An acyclic economic indicator is one that has no relation to the health of the economy and is generally of little use.
2. Frequency of the Data In most countries GDP figures are released quarterly (every three months) while the unemployment rate is released monthly. Some economic indicators, such as the Dow Jones Index, are available immediately and change every minute.
3.Timing Economic Indicators can be leading, lagging, or coincident which indicates the timing of their changes relative to how the economy as a whole changes. • Leading: Leading economic indicators are indicators which change before the economy changes. Stock market returns are a leading indicator, as the stock market usually begins to decline before the economy declines and they improve before the economy begins to pull out of a recession. Leading economic indicators are the most important type for investors as they help predict what the economy will be like in the future. • Lagged: A lagged economic indicator is one that does not change direction until a few quarters after the economy does. The unemployment rate is a lagged economic indicator as unemployment tends to increase for 2 or 3 quarters after the economy starts to improve. • Coincident: A coincident economic indicator is one that simply moves at the same time the economy does. The Gross Domestic Product is a coincident indicator.
Types of Economic Indicators • Total Output, Income, and Spending • HDI(Human Development Index) • Rainfall Index • FDI • Employment, Unemployment, and Wages • Production and Business Activity • Prices • Money, Credit, and Security Markets • Federal Finance • International Statistics
Total Output, Income, and Spending • Gross Domestic Product (GDP) [quarterly] • Real GDP [quarterly] • Business Output [quarterly] • National Income [quarterly] • Consumption Expenditure [quarterly] • Corporate Profits[quarterly] • The Gross Domestic Product is used to measure economic activity and thus is both procyclical and a coincident economic indicator. The Implicit Price Deflator is a measure of inflation. Inflation is procyclical as it tends to rise during booms and falls during periods of economic weakness. Measures of inflation are also coincident indicators. Consumption and consumer spending are also procyclical and coincident.
Human Development Index • HDI is a measure of poverty, literacy, education, life expectancy, childbirth, and other factors. It is a standard means of measuring well being, especially child welfare. HDI stresses the importance of the quality of life. The three basic dimensions of HDI : 1) Life expectancy at birth 2) Knowledge (as measured from adult literacy rate) 3) Standard of living
HDI - PARAMETERS ( 1) Education It is an expression of human development. It helps to develop knowledge, skills, makes people healthier, confident & provide greater access to land, jobs and financial resources, it is a key driving force against poverty.
Human Development Index EDUCATION : • Literacy rates in India have arisen dramatically from 18% in 1951 to 65% in 2001, but these rates are still far from the level of 95%. • Literacy among males is nearly 50% higher than females, and it is about 50% higher in urban areas as compared to the rural areas. • Literacy rates range from as high as 96% in some districts of Kerala to below 30% in some parts of Madhya Pradesh.
(2 ) HealthCare • Health is Wealth. A healthy body makes • one feel confident, makes him highly • immune to diseases. It increases the level of productivity and thereby enhance economic growth.
Gender Equity Women make up half of the world’s population (more than 3.3 billion people),yet experience the brunt of the world’s poverty, illiteracy and violent crime.ST / SC tribes face natural obstacles everywhere • Source : UNDP Survey, 2008
Poverty 27.5 percent of Indians live below the national income poverty line. More than 60 percent of women are chronically poor .296 million people are illiterate 233 million are undernourished ( espl.Below 3 years)
BENEFITS OF HDI( the index) AIM of Human Development Index • It helps in prioritizing sectors which have serious crisis & necessitates appropriate action plan It helps to create various pump priming project in sectors like : • 1. HealthCare Sector ( Eg : the creation of National Rural Health Mission) 2. Education (the creation of SarvaShikshaAbiyan) • 3. Decent standard of living (measured by purchasing power parity, income).(The creation of National Rural Emplyoment Guarantee Scheme)
Rainfall Index • 58% of country's population depends on agriculture 27% of India ’s GDP comes from its agricultural production. • 13-18% of India ’s total annual exports are agricultural products. • Good monsoon always means a good harvest • Bad monsoon results in a big loss in the country GDP levels.
FDI in India • FDI is investment made by a foreign individual or company in productive capacity of another country. It is the movement of capital across national frontiers in a manner that grants the investor control over the acquired asset. • India is considered a stable country for investing in by corporate overseas. • FDI is a tool for jump-starting economic growth through its bolstering of domestic capital, productivity and employment.
FDI in India FDI has an impact on • Country's trade balance • Increasing labour standards and skills • Transfer of new technology and innovative ideas • Improving infrastructure, skills and the general business climate. US INVESTMENT IN INDIA • U.S. is one of the largest foreign direct investors in India. • The stock of actual FDI Inflow increased from U.S. $11.3 million in 1991 to US $4132.8 million as on August 2004 recording an increase at a compound rate of 57.5 percent per annum. • The FDI inflows from the US constitute about 11 percent of the total actual FDI inflows into India.
Employment, Unemployment, and Wages • These statistics cover how strong the labor market is and they include the following: • The Unemployment Rate [monthly] • Level of Civilian Employment[monthly] • Average Weekly Hours, Hourly Earnings, and Weekly Earnings[monthly] • Labor Productivity [quarterly] • The unemployment rate is a lagged, countercyclical statistic. The level of civilian employment measures how many people are working so it is procyclic. Unlike the unemployment rate it is a coincident economic indicator
Production and Business Activity • These statistics cover how much businesses are producing and the level of new construction in the economy: • Industrial Production and Capacity Utilization [monthly] • New Construction [monthly] • New Private Housing and Vacancy Rates [monthly] • Business Sales and Inventories [monthly] • Manufacturers' Shipments, Inventories, and Orders [monthly] • Changes in business inventories is an important leading economic indicator as they indicate changes in consumer demand.
Prices • This category includes both the prices consumers pay as well as the prices businesses pay for raw materials and include: • Producer Prices [monthly] • Consumer Prices [monthly] • Prices Received And Paid By Farmers [monthly] These measures are all measures of changes in the price level and thus measure inflation. Inflation is procyclical and a coincident economic indicator.
Money, Credit, and Security Markets • These statistics measure the amount of money in the economy as well as interest rates and include: • Money Stock (M1, M2, and M3) [monthly] • Bank Credit at All Commercial Banks [monthly] • Consumer Credit [monthly] • Interest Rates and Bond Yields [weekly and monthly] • Stock Prices and Yields [weekly and monthly] • Nominal interest rates are influenced by inflation, so like inflation they tend to be procyclical and a coincident economic indicator. Stock market returns are also procyclical but they are a leading indicator of economic performance.
Federal Finance • These are measures of government spending and government deficits and debts: • Federal Receipts (Revenue)[yearly] • Federal Outlays (Expenses) [yearly] • Federal Debt [yearly] • Governments generally try to stimulate the economy during recessions and to do so they increase spending without raising taxes. This causes both government spending and government debt to rise during a recession, so they are countercyclical economic indicators. They tend to be coincident to the business cycle.
International Trade • These are measure of how much the country is exporting and how much they are importing: • Industrial Production and Consumer Prices of Major Industrial Countries • U.S. International Trade In Goods and Services • U.S. International Transactions • When times are good people tend to spend more money on both domestic and imported goods. The level of exports tends not to change much during the business cycle. So the balance of trade (or net exports) is countercyclical as imports outweigh exports during boom periods. Measures of international trade tend to be coincident economic indicators. • While we cannot predict the future perfectly, economic indicators help us understand where we are and where we are going.
Salient features of Indian Economy • Agrarian Economy • High Population • Unequal Distribution of Income and Wealth • Centralization • Prevalence of Zamindari system • Lack of proper Infrastructure • Low Percapita Income • Less Economic Welfare • Developing Economy • Mixed Economy • Low Quality of Life • Illiteracy and skill shortage • Fragmentations and Distortions of Markets
Cont…… • High Levels of Unemployment & Underemployment • Less Production • Unfavourable BOP • Prevalence of Povety • Lack of Social Security Measures • Scarcity of natural Resources • Lack of Capital • Brain Drain • High Dependency Burdens • Low Level of Productivity • Technological Backwardness
Structure of Indian Economy Over the last 56 years, the Indian economy has experienced a gradual structural change. Though the pace of the structural transformation was more or less slow throughout the pre-reform period, it has become rapid after the introduction of new economic reforms in the decade of the nineties. At the time of independence, Indian economy was predominantly rural and agricultural. At the beginning years of the First Five-year Plan, contribution of the primary sector (agriculture, forestry and logging, fishing) in GDP at factor cost was largest followed by tertiary sector and secondary sector respectively. Thereafter the major drive towards diversification and modernization of the Indian economy in the following plans resulted in increased shares of the secondary and tertiary sectors and declined share of the primary sector in the national product.
Cont… The share of the primary sector in GDP at factor cost declined from 54.56% in 1950-51 to 27.87% in 1999-00 while share of the secondary sector was 16.11% in 1950-51 and increased to 25.98% in 1999-00. The share of the tertiary sector increased from around 29% to 46% during this period. Indian economy also experienced a major structural change within the industrial sector as a result of the major drive for industrial diversification in the mid-fifties.
Cont….. • However, the pace of transition of the Indian economy from an agricultural economy to an industrial • one was quite slow since 1951. It was in the decade of the eighties the economy emerged from the phase of • slow growth rate and deceleration. Finally, a major shift in the macroeconomic policies in the decade of the • nineties accelerated the pace of the structural transformation of the Indian economy and set India on a high • growth trajectory. In terms of average growth rate, the performance in the nineties (6.5%) was better than that • recorded in the eighties (5.8%). While both the industrial and service sectors registered relatively high growth • rates during recent period, agriculture and allied activities experienced a relatively low rate of growth as
Cont………. • compared to the eighties. This underlines a major structural shift in the Indian economy in recent years, with • economic growth becoming more vulnerable to the performance of industrial and service sectors and less to • the performance of the agricultural sector. In order to keep the momentum of the structural transformation of • the Indian economy, investment should be concentrated to those sectors which are strongly integrated with the • rest of the economy and have a larger multiplier effect on growth and development.
Classification of Sectors • All economic activities can be classified into three broad categories according to the factors used • intensively in the production process. These three categories are: • (a) Ricardo sectors. • (b) High technology sectors • (c) Heckscher - Ohlin sectors. • RICARDO SECTORS: Ricardo sectors are those which use natural resources intensively in their production • process. Production of agricultural crops and other allied activities like milk and milk products, animal • services, forestry and logging, fishing are basically natural resource intensive and therefore treated as Ricardo • sectors. By the same argument minerals like coal and lignite, crude petroleum and natural gas, iron ore, • metallic and non metallic minerals are included in the category of Ricardo sectors. The industries like leather products, petroleum products, cement are characterized by intensive use of natural resources and therefore are regarded as Ricardo sectors. T
HIGH-TECHNOLOGY SECTORS: The sectors requiring relatively higher proportion of research and • development are included into the second category called High-Technology sectors (H-T sectors). This • category contains most of the sophisticated technology-using manufacturing sectors like industrial electrical • and non-electrical machines, electronic equipment, transport equipment, communication equipment, • pesticides, heavy chemicals etc. Education and research, medicines and drugs, medical and health, • communication are also regarded as H-T sectors because these sectors require higher proportion of research • and development. There are all total twenty-three sectors in this category. • HECKSCHER-OHLIN SECTORS: The sectors that use relatively standardized production technologies are • regarded as Heckscher-Ohlin sectors (H-O sectors). In other words, H-O category contains the sectors which • are either capital or labour intensive. This category consists of capital intensive sectors like iron & steel, • fertilizers, synthetic fiber and resin, non-ferrous basic metals, rubber and plastic products etc. and labour • intensive sectors like printing and publishing, furniture and fixtures, miscellaneous manufacturing etc. Being • 6 • labour intensive sectors banking and insurance, transport services, trade, other services
HECKSCHER-OHLIN SECTORS: The sectors that use relatively standardized production technologies are • regarded as Heckscher-Ohlin sectors (H-O sectors). In other words, H-O category contains the sectors which • are either capital or labour intensive. This category consists of capital intensive sectors like iron & steel, • fertilizers, synthetic fiber and resin, non-ferrous basic metals, rubber and plastic products etc. and labour • intensive sectors like printing and publishing, furniture and fixtures, miscellaneous manufacturing etc. Being • 6 • labour intensive sectors banking and insurance, transport services, trade, other services
Measures for Development • Increasing Capital formation • Improving Human Capital • Raising Entrepreneurship Ability • Enhancing Natural Resources • Upgrading Technology • Market Orientation of an Economy • Need for Planning • Important Role of State