Download

1 / 23
230 likes | 424 Views
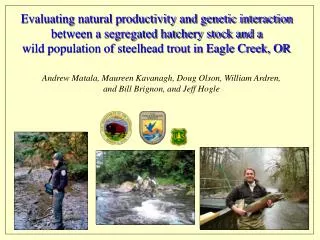
Evaluating natural productivity and genetic interaction between a segregated hatchery stock and a wild population of steelhead trout in Eagle Creek, OR . Andrew Matala, Maureen Kavanagh, Doug Olson, William Ardren, and Bill Brignon, and Jeff Hogle.

E N D
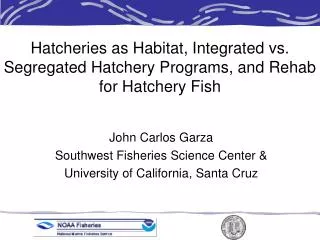
Evaluating natural productivity and genetic interaction between a segregated hatchery stock and a wild population of steelhead trout in Eagle Creek, OR Andrew Matala, Maureen Kavanagh, Doug Olson, William Ardren, and Bill Brignon, and Jeff Hogle
Background: Eagle Creek-NFH steelhead program • Mitigate for resource loss: Bonneville Dam • Provide commercial, sport, and tribal harvest • Broodstock origin: • Big Creek Hatchery broodstock, • local population (native Eagle Creek, Skamania Hatchery) • Return-time distribution: • HAT – generally December through March • NOR – generally February through June • Wild winter steelhead considered unique run • North Fork Eagle Creek is major spawning area. • USFWS commenced M&E in 2003: • Ecological Interaction Study: review 2005-08 • Effects on ESA listed NOR population
Eagle Cr. HAT Big Cr. HAT Clackamas R. NOR Eagle Cr. NOR 99 100 0.005 -Campton 2001
Ecological Interaction studies at Eagle Creek “Impact of segregated hatchery program on ESA listed wild population?” “How to manage the hatchery program at optimal benefit?” • Rearing Density Study • Optimize release number/return number • Behavioral and Habitat Study • Competitive interactions, residualism, outmigration • Radio-telemetry project • Adults- distribution, straying, migration timing • Genetics Study • Hat vs. Wild: distribution and productivity.
Outline of Objectives: Genetics Analysis • Evaluate Population Structure: • Relative productivity between NOR and HAT? • If so, where does HAT natural spawning occur? • Collection locations (sample reaches): • Based on distribution, utilizing available capture sites • Target was 50 smolts per reach per year • Analytical Methods • Genetic distance • Likelihood based population assignment • Population “membership” proportions • Among-group variation (Fst) • Explore biological relevance or significance: • Explain results in the context of general ecological interaction? • Evaluate risks to NOR – fitness, distinctiveness?
Lower Reach N. Fork Reach Upper Reach Ecological Interaction studies at Eagle Creek Eagle Creek-NFH Study Site
Outline of Objectives: Genetics Analysis • Evaluate Population Structure: • Relative productivity between NOR and HAT? • If so, where does HAT natural spawning occur? • Collection locations (sample reaches): • Based on distribution, utilizing available capture sites • Target was 50 smolt per reach per year • Analytical Methods • Genetic distance • Likelihood based population assignment • Population “membership” proportions • Among-group variation (Fst) • Explore biological relevance or significance: • Explain results in the context of general ecological interaction? • Evaluate risks to NOR – fitness, distinctiveness?
Neighbor-Joining Dendrogram Topology - temporal replicate collections: 3 years NOR adult 2007 NOR adult 2006 Upper EC 2005 Lower EC 2005 ECNF 2007 Lower EC 2006 ECNF 2006 56.2 76.8 90.4 90.4 ECNF 2005 Upper EC 2006 100 100 57.5 Upper EC 2007 NOR adult 2005 N. Fork EC 2006 N. Fork EC 2007 0.002 CSE N. Fork EC 2005 Lower EC 2007
2005 2006 2007 Estimated Population Assignment Likelihood Lower Eagle Creek Hatchery Equal likelihood
2005 2006 2007 Estimated Population Assignment Likelihood North Fork Eagle Creek Hatchery Equal likelihood
2005 2006 2007 Estimated Population Assignment Likelihood Upper Eagle Creek Hatchery Equal likelihood
2005 2006 2007 2005 2006 2007 membership Upper Eagle Creek Eagle Creek-NFH 2005 2006 2007 2005 2006 2007 Eagle Creek-NFH N. Fork Eagle Creek 2005 2006 2007 2005 2006 2007 Lower Eagle Creek Eagle Creek-NFH STRUCTURE version 2.0 Population Membership Plots: K= 3 inferred populations
Evaluating among-group variation: pairwise comparisons: NOR perspective = temporal replicate collections (by NOR collection) Pairwise Fst Upper Eagle N. Fork Eagle Lower Eagle NOR adults
Evaluating among-group variation: pairwise comparisons: NOR perspective = temporal replicate collections Vs. 2005Hatchery Pairwise Fst Upper Eagle N. Fork Eagle Lower Eagle NOR adults
Evaluating among-group variation: pairwise comparisons: NOR perspective = temporal replicate collections Vs. 2006 Hatchery Pairwise Fst Upper Eagle N. Fork Eagle Lower Eagle NOR adults
Evaluating among-group variation: pairwise comparisons: NOR perspective = temporal replicate collections Vs. 2007 Hatchery Pairwise Fst Upper Eagle N. Fork Eagle Lower Eagle NOR adults
NOR 2007 NOR NOR Upper EC Upper EC Upper EC Evaluating among-group variation: Summary: Hatchery Perspective 0.0400 2005 2006 0.0350 0.0300 0.0250 0.0200 0.0150 0.0100 0.0050 0.0000 ’05 hatchery ’06 hatchery ’07 hatchery Vs. Hatchery 2005 Vs. Hatchery 2006 Vs. Hatchery 2007 -0.0050
Outline of Objectives: Genetics Analysis • Evaluate Population Structure: • Relative productivitybetween NOR and HAT? • If so, where does HAT natural spawning occur? • Collection locations (sample reaches): • Based on distribution, utilizing available capture sites • Target was 50 smolt per reach per year • Analytical Methods • Genetic distance • Likelihood based population assignment • Population “membership” proportions • Among-group variation (Fst) • Explore biological relevance or significance: • Explain results in the context of general ecological interaction? • Evaluate risks to NOR – fitness, distinctiveness?
31% 10% 1% 38% 17% 17% 33% 29% 16% Adult: Distribution, Movement Mouth 2005 & 2006 Lower Ladder Eagle Creek North Fork Eagle Creek Middle Ladder NF Hatchery Last Known Location of Radio-tagged Steelhead Hatchery: N=87 Delph Creek Wild: N=52
Bi-weekly catch of adult winter steelhead ~ captures at the lower ladder Wild (n=31) Hatchery (n=182) Wild (n=30) Hatchery (n=144) Wild (n=42) Hatchery (n=53) 50 40 30 20 10 0 % Captured Feb 1-15 Feb 1-15 Jan 1- 15 Jan 1- 15 Jan 16-30 Jan 16-30 May 1-15 May 1-15 Feb 16-28 Feb 16-28 April 1-15 April 1-15 May 16-31 May 16-31 March 1-15 March 1-15 April 16- 30 April 16- 30 March 16- 31 March 16- 31 Feb 1-15 Jan 1- 15 Jan 16-30 May 1-15 June 1-10 Feb 16-28 April 1-15 May 16-31 March 1-15 April 16- 30 March 16- 31 2005 2006 2007
Conclusions/Management Implications: Geneflow is restricted – variable by year Behaviors are different – variable by year How much gene flow is too much gene flow? Generational Scale? Currently: continue segregated broodstock collection 150,000 yearling smolt 100,000 smolts trapping and removal Three additional years, continued monitoring
Thanks! Any Questions? Acknowledgements: Co-authors, especially Maureen Kavanagh, USFWS and USFS field crews The findings, conclusions and opinions expressed in this presentation are those of the authors and do not necessarily represent the views of the United States Fish and Wildlife Service. TM RIVERFISH.net