Download
1 / 12
130 likes | 240 Views
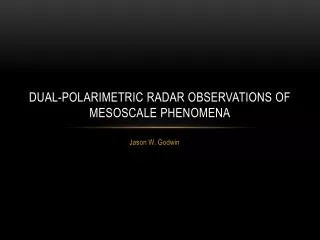
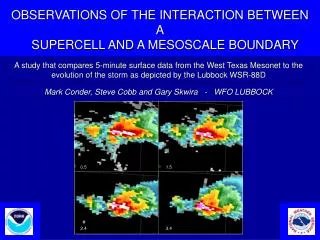
OBSERVATIONS OF THE INTERACTION BETWEEN A SUPERCELL AND A MESOSCALE BOUNDARY. A study that compares 5-minute surface data from the West Texas Mesonet to the evolution of the storm as depicted by the Lubbock WSR-88D. Mark Conder, Steve Cobb and Gary Skwira - WFO LUBBOCK. 0.5. 1.5. 2.4.

E N D
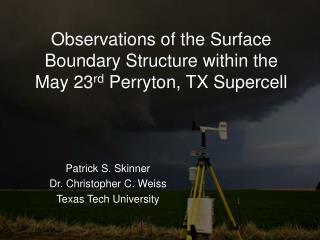
OBSERVATIONS OF THE INTERACTION BETWEEN A SUPERCELL AND A MESOSCALE BOUNDARY A study that compares 5-minute surface data from the West Texas Mesonet to the evolution of the storm as depicted by the Lubbock WSR-88D Mark Conder, Steve Cobb and Gary Skwira - WFO LUBBOCK 0.5 1.5 2.4 3.4
500 hPa 850 hPa Objectively analyzed constant pressure maps for 5 October 2003 12 GMT • @ 500 hPa, CAA and PVA greatest across the northern TX Panhandle • @ 850 HPa, deep, rich moist tongue across West-central TX Modest SW wind with WAA – θe advection
250 hPa 500 hPa RUC model isotach and streamline analysis for 5 October 2003 12 GMT. • @ 250 hPa, ~60 kt jetmax over NE New Mexico – southern Panhandle in RR quadrant by afternoon • @ 500 HPa, fairly constant 20-30 kt core oriented NW-SE across region of storm initiation
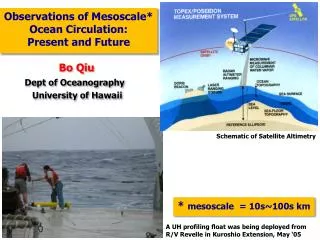
Surface to 250 hPa sounding from the West Texas Mesonet Reese Center site for 5 October 2003 20 GMT (position shown by the white star on the visible satellite image. The sounding has been modified with surface observations taken from mesonet sites west (red) and east (blue) of the outflow boundary.
West of outflow boundary East of outflow boundary Hodographs of the wind profile for 5 October 2003 20 GMT. The hodographs have been modified with surface observations taken from mesonet sites west and east of the outflow boundary. The fifth point roughly corresponds to one kilometer AGL.
Reese Center sounding derived parameters 0-6 km mean wind: 277º @ 20 kts * Using a storm motion vector of 320/18 kts (Bunkers method)
500 hPa storm relative flow • RUC Forecast • Mid-level storm-relative winds of 7- 10 ms-1 mark transition from non-tornadic to tornadic (Thompson, 1998) • Davies used ETA forecast of 8 ms-1 as a threshold. • RUC shows about 9-10 ms-1 for a right-moving supercell – may be over done
Timeline of storm reports on 5-6 October 2003 Swisher Co. (9SE Tulia to 8E Kress) 2305-2320Z Tornado (F1) Swisher Co. (6SE Tulia) 2310Z Hail (2.75 inch) Swisher Co. (10ESE Kress) 2334-2335Z Tornado (F0) Floyd Co. (3NW Lockney) 0005Z Hail (0.88) Swisher Co. (5E Tulia) 0020Z Hail (1.75) Large hail reports associated with this storm continued through 0120Z, with no additional tornado reports. Additionally, large hail (0.88 to 1.75 inch) was reported with other thunderstorm activity located southwest of storm of interest, as well as with new development immediately west-northwest.
Visible satellite imagery for 5 October 2003 2001 GMT • Red lines are contours of MSAS derived surface temperature advection. Max located in vicinity of “triple-point”. • Cold front located across the Permian Basin into central TX – nearly stationary • Blue line represents an outflow boundary slowly moving west. Low clouds and stable air behind boundary • Brown and yellow lines are weak dryline and Pacific front • The location of the Reese Center West Texas Mesonet site is highlighted by a white star.
Graph of the rotational velocity associated with the mesocyclone for the 3 lowest elevation angles of the Lubbock WSR-88D.
SUMMARY AND DISCUSSION • How to explain tornado development in high CIN (79 J/Kg) / marginally high LFC (~2000 m) environment? • Although there was large 0-1 km SRH, stretching of low-level vorticity becomes disconnected from region of ascent thus reducing chances of tornado development (Davies, 2004) • 1. Virtual temperature calculation (Doswell and Rasmussen, 1994) The general effect raises CAPE, lowers CIN and LFC height on profiles that have a deep moist layer (Davies, 2004) • 2. Davies suggests that strong vertical shear may overcome large CIN by inducing strong vertical pressure gradients that enhance upward accelerations • Another mechanism might be an ADVANCING warm front, with strong low-level WAA into region near/below the cap - Questionable in this case • Best guess: Combination of all three factors mentioned above proved sufficient to produce the F1 tornado in this case. Negative factors most likely contributed to the short life span of the tornado
SUMMARY AND DISCUSSION CONTINUED • West Texas Mesonet observations provided great utility in diagnosing boundary motion and surface thermodynamic and kinematic fields in vicinity of the boundary • The outflow boundary caused changes in the storm environment that altered the storm type. The WTXM obs may allow the forecaster to anticipate these changes • The WTXM Sounding provided similar utility in helping the forecaster assess the vertical profile of the storm environment • Subjective analysis of 5-min observations the duty of mesoscale analyst?