Download

1 / 22
240 likes | 532 Views
Cardiovascular System Block The Electrocardiogram (ECG). Dr. Mona Soliman, MBBS, MSc, PhD Department of Physiology Chair of Cardiovascular Block College of Medicine King Saud University. Lecture Objectives. Identify waves of the normal ECG and the physiological cause of each

E N D
Cardiovascular System BlockThe Electrocardiogram (ECG) Dr. Mona Soliman, MBBS, MSc, PhD Department of Physiology Chair of Cardiovascular Block College of Medicine King Saud University
Lecture Objectives • Identify waves of the normal ECG and the physiological cause of each • Define the normal intervals in the ECG trace • Determine the bipolar, unipolar and chest leads
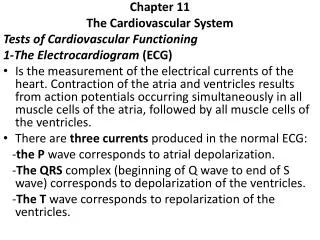
The Normal Electrocardiogram (ECG) The depolarization wave spread through the heart electrical currents pass into the surrounding tissue part of the current reaches the surface of the body • The electrical potentials generated by these currents can be recorded from electrodes placed on the skin opposite the heart
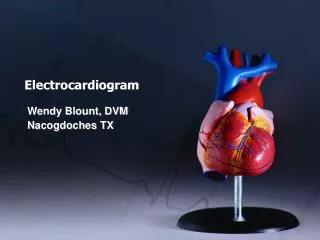
The Normal Electrocardiogram (ECG) • The Electrocardiogram (ECG) is a recording of the electrical activity of the heart
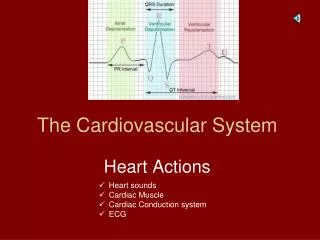
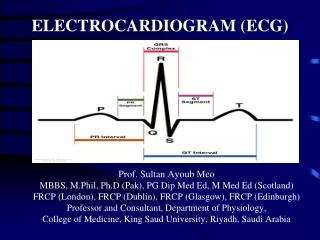
The Normal Electrocardiogram (ECG) • P wave:is caused by atrial depolarization • QRS complex: is caused by depolarization of the ventricles • T wave: repolarization of the ventricles
Voltage and Calibration of the ECG • The vertical calibration lines: Voltage(millivolt) • 5 small lines = 1 mV • The horizontal calibration lines: Time (seconds) • 1 inch(25 small lines) = 1 second • Each inch is divided by 5 dark vertical lines • The interval between the dark lines= 0.2 second • thin line=0.04 second
P-R interval • It is the time between the beginning of the P wave and the beginning of the QRS complex • It is the interval between the beginning of electrical excitation of the atria and the beginning of excitation of the ventricles • The P-R interval is about 0.16 second
Q-T interval • Contraction of the ventricles last from the beginning of the Q wave to the end of the T wave • Q-T interval is the time from the beginning of the Q wave to the end of the T wave • Q-T interval is about 0.35 second
Heart Rate • The heart rate is the repetition of the time interval between two successive heartbeats • If the interval between 2 beats is 1 second , the heart rate is 60 beats per minute
Methods for Recording Electrocardiograms Computer-based and electronic display Pen recorder and a moving sheet
Flow of Electrical current in the Heart • In normal ventricles, current flows from negative to positive from the base of the heart toward the apex • The first area that depolarizes is the ventricular septum
Flow of Electrical current in the Heart • Current flows from the electronegative inner surface of the heart to the electropositive outer surface (from the base of the heart to the apex) • An electrode placed near the base of the heart is electronegative, and near the apex is electropositive
The ECG Leads • Lead: two wires and their electrodes to make a complete circuit • The Bipolar Limb Leads: (I, II, III) • Chest Leads: (V1, V2, V3, V4, V5, V6) • Augmented Unipolar Limb Leads (aVR, aVL, aVF)
The Bipolar Limb Leads • Bipolar: means that the ECG is recorded from two electrodes • Lead I: • The right arm : –ve • The left arm: +ve • Lead II: • The right arm: -ve • The left leg: +ve • Lead III: • The left arm: -ve • The left leg: +ve
Chest Leads • Recorded from the anterior surface of the chest (V1, V2, V3, V4, V5, V6) • Positive electrode on the chest • The indifferent electrode is the negative electrode connected to the right arm, left arm, and left leg
Chest Leads • V1 and V2: QRS are mainly negative because the chest leads are nearer to the base of the heart • V3,V4 and V6 are mainly positive because the chest electrode are nearer to the apex
Augmented Unipolar Leads • The two limbs are connected to the negative terminal of the ECG, and the third limb is connected to the positive • When the positive terminal is on: • The right arm (aVR) • The left arm (aVL) • The left leg (aVF) • All are similar to the standard limb leads • aVRlead is inverted
Practical use of the ECG • Heart rate • Normal intervals • Rhythm • Regular • Single p-wave precedes every QRS complex • P-R interval is constant and within normal range • Cardiac axis Axis
Einthoven’s Triangle • Enthoven’s Triangle: is drawn around the area of the heart • The two apices at the upper part of the triangle represent the points at which the two arms connect electrically • The lower apex is the point at which the left leg connects
Einthoven’s Law • Einthoven’s Law: if the electrical potential of any two of the three bipolar limb leads are known, the third one can be determined mathematically by summing the first two (note the +ve and -ve signs) • The sum of the voltage in Lead I + Lead III= Lead II • Einthoven’s law
For further readings and diagrams: Textbook of Medical Physiology by Guyton & Hall Chapter 11 (The Normal Electrocardiogram)