Download
1 / 57
590 likes | 1.16k Views
Human Population Growth Chapter 4 (and Section 3.3). Dynamics of human population growth Human populations are like other pops. Natality factors Mortality factors Age structure Demographic transition Future human population. What is a population? (Chapter 3 – Section 3.3).

E N D
Human Population GrowthChapter 4 (and Section 3.3) • Dynamics of human population growth • Human populations are like other pops. • Natality factors • Mortality factors • Age structure • Demographic transition • Future human population
What is a population?(Chapter 3 – Section 3.3) • Population = a group of organisms of the same species that occurs in a particular area • Boundaries somewhat arbitrary • Can potentially interbreed
Attributes of populations: • Abundance - total numbers • Density - #s per unit area • Dispersion - distribution of individuals in space • Structure - makeup of individuals (age, sex, size, )
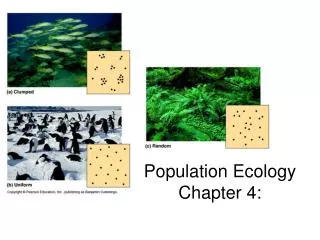
Members of a population may be dispersed as: • Random - Individuals are not affected by each other • Uniform - Individuals tend to repel each other • Clustered - Individuals tend to attract each other Fig. 3.23
Dynamics of Population Growth • Exponential Growth - Growth at a constant rate of increase per unit time (= Geometric)=“J-shaped” growth≠Arithmetic Growth (Increases at constant amount per unit time)
Population grows as a function of its intrinsic growth rate (r) Population growth (DN) is just Births - Deaths over time (Dt)But, Births & Deaths obviously depend on NSo to compare pops. of different sizes we use percapita Birth & Death rate (B & D, respectively)Then, we let B - D = r,And thus, for a given time (Dt), pop. growth is: DN = r • NDt
How does population change over time?Nt = N(t-1) ert • If r > 0, pop. grows exponentially • Doubling Time of a population ≈ 70 / r (%) • When a pop. increases at its maximum r, it is growing at its Biotic Potential
Pop. increases as a % of its current size (like compound interest) • Function of its geneticpotential • Varies with species
Whooping crane population at Patuxent Wildlife Refuge, Maryland
B. Logistic Growth • No pop. can grow exponentially forever—> ultimately limited by its environment= Environmental Resistance or Feedback • Logistic Growth = Growth rates are regulated by environmental factors • “S-Shaped” growth curve • Growth rate slows as population approaches its Carrying Capacity
Growth of some laboratory populations fits the S-shaped curves fairly well
Logistic model provides a basis to which we can compare real populations • Natural populations tend to oscillate over time
Population Oscillations (3 stages): • Malthusian Growth (Irruptive Growth) • Population explosions driven by biotic potential • Overshoot - Population exceeds carrying capacity of its environment • Dieback - Negative growth • Severity of dieback is related to the extent of overshoot
Note that Overshoot of carrying capacity may degrade it over time Figure 3.18
Severe overshoot of Carrying Capacity may reduce K in future (caribou on Pribilof Islands)
Population Success Involves Tradeoff between Biotic Potential vs. Survival at K • Evolutionary strategies that favor increased biotic potential (r) • Rapid growth • Early maturity • Many small offspring • Little parental care • Adapted to: • Unstable environment • Colonizers after disturbance • Niche generalists
Human population growth history • ~100 million people on Earth in 1000 B.C. • Took 1800 years to reach 1 billion (1800) • Reached 2 billion in 1930 (130 yr doubling time) • Reached 4 billion in 1975 (45 yr doubling time) • Reached 6 billion in 1999 (~60 yr doubling time) • Human population tripled during the 20th century ! * November, 2012: World population passes 7 billion
Current World Population Growth: Birth and Death Rates • Every second: about 4 children are born, while about 2 other people die • Net gain: ~2.35 humans added to the world population every second, ≈75 million added every year
World Population Growth Rate • In exponentially growing populations: • Doubling Time = 70 / (% growth rate) • So, % growth rate = 70 / doubling time • Population doubled from 1960 to 2000: • Growth Rate = 70/40 = 1.8% • Population is currently growing at 1.14% • Doubling Time = 70/1.14% = 61 years
World population growth rate 1950-2010 2010 Projected
I. Human Population Demography • Demography - vital statistics about people, such as births and deaths • Includes underlying causes of population growth and distribution • Population age structure • Socio-economic conditions • Two Worlds: • Less-developed counties represent 80% of the world population, and more than 80% of projected growth • Richer countries that tend to have low or negative growth rates
Population Growth - Opposing Factors:Natality & Mortality • Factors Increasing Population: • Natality (Births) • Crude Birth Rate - # of births / year per 1000 • Total Fertility Rate - # of children born to an average woman in a population during her life • A good way to project population growth • Also Includes Immigration - movement of individuals into a population
Factors decreasing population size • Mortality (Death) • Crude Death Rate - # of deaths per 1000 persons in a given year • Life expectancy - Probable number of years of survival for an individual of a given age • Life Span - Longest possible lifetime • Also Includes Emigration - Movement of individuals out of a population • Zero population growth (ZPG) - occurs when births + immigration just equal deaths + emigration
Life expectancy Fig. 4.8
II. Population Age Structure & Demographic Transition • How population is changing (and will change in the future depends on current Age Structure • Growing vs. declining populations have different proportions of individuals in various age classes
Rapidly expanding populations have many pre-reproductive individuals (high pop. momentum) • Age-Structure diagram is a pyramid • Stationary Populations have balanced natality and mortality • Age-Structure shows no bulges • Diminishing Populations have fertility below replacement level (< ~2.1) • Age-Structure shows bulge in upper age classes
Age Structure Diagrams Fig. 4.9
Industrialization & Demographic Transition • Death rates and birth rates decline as economic development improves living conditions (4 phases) • Pre-Developed Country —> Death rates high, thus birth rates are correspondingly high • Economic Development —> Better conditions, thus death rates fall (High Pop. growth rate!) • Eventually, birth rates decline • Developed Country - Population is in equilibrium
Demographic Transition in U. S. Figure 4.12
III. Current World Situation: • Global population growth rate is ~1.14 % • Net gain: 2.3 humans added to the world population every second, 72 million added every year • These numbers do not indicate anything about global variability !
Two Demographic Worlds • First is wealthy, old, and mostly shrinking • North America, Western Europe, Japan • Average age is about 40 • Populations are declining or expected to decline • Second is poor, young, and rapidly growing • Less-developed countries • Africa, Asia, Latin America • Contain 80% of world population, and will account for 90% of projected growth
Population Growth - Opposing Factors: Rich vs. Poor Countries • Total Fertility Rate: • 5.5 in poor countries vs. • 1.6 in wealthy countries • 2.7 worldwide average • Crude Death Rate: • > 20 per 1000 in poor versus • < 10 per 1,000 in wealthy
IV. Future of Human Population • Most demographers believe the world population will stabilize sometime during this century • Projections of maximum population size: • Low 8 billion • Medium 9.5 billion • High 13 billion • Ultimate pop. size depends on “Carrying Capacity” of Earth for humans • But what is that??
Some demographers suggest Carrying Capacity is 10-12 billion Fig. CL 4.2
Population Growth - Opposing Factors:Malthus vs. Marx • Thomas Malthus (1798) argued human populations tend to naturally increase exponentially —> inevitably outstrip food supply and resources —> poverty & social decline—> populations crash—> cycle repeats (usually in a new location) • But how does this apply to the whole Earth?
Karl Marx (1845) argued that population growth is a symptom rather than a root cause of poverty and other social problems • The way to slow population growth and alleviate exploitation and oppression is through social justice
Technological optimists argue that Malthus was wrong b/c he failed to account for scientific progress • Current pop. growth was stimulated by the scientific and industrial revolutions • Human ingenuity and intelligence increase with numbers • More people mean larger markets, more efficiency