National Youth Risk Behavior Survey, 2017
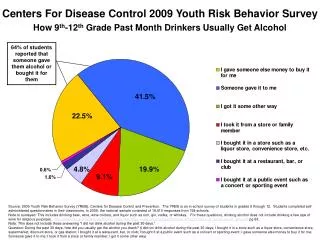
Sexual Behaviors that Contribute to Unintended Pregnancy and Sexually Transmitted Infections, Including HIV Infection. Percentage of High School Students Who Ever Had Sexual Intercourse, by Sex, * Grade,* and Race/Ethnicity,* 2017.


National Youth Risk Behavior Survey, 2017
E N D
Presentation Transcript
Sexual Behaviors that Contribute to Unintended Pregnancy and Sexually Transmitted Infections, Including HIV Infection
Percentage of High School Students Who Ever Had Sexual Intercourse, by Sex,* Grade,* and Race/Ethnicity,* 2017 *M > F; 10th > 9th, 11th > 9th, 11th > 10th, 12th > 9th, 12th > 10th, 12th > 11th; B > W (Based on t-test analysis, p < 0.05.) All Hispanic students are included in the Hispanic category. All other races are non-Hispanic. Note: This graph contains weighted results. National Youth Risk Behavior Survey, 2017
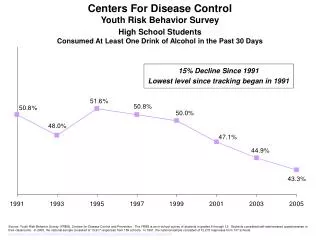
Percentage of High School Students Who Ever Had Sexual Intercourse, 1991-2017* *Decreased 1991-2017 [Based on linear and quadratic trend analyses using logistic regression models controlling for sex, race/ethnicity, and grade (p < 0.05). Significant linear trends (if present) across all available years are described first followed by linear changes in each segment of significant quadratic trends (if present).] Note: This graph contains weighted results. National Youth Risk Behavior Surveys, 1991-2017
Range and Median Percentage of High School Students Who Ever Had Sexual Intercourse, Across 33 States and 20 Cities, 2017 State and Local Youth Risk Behavior Surveys, 2017
Percentage of High School Students Who Ever Had Sexual Intercourse 29.1% - 35.0% 35.1% - 37.6% 37.7% - 39.0% 39.1% - 45.9% No Data State Youth Risk Behavior Surveys, 2017
Percentage of High School Students Who Had Sexual Intercourse for the First Time Before Age 13 Years, by Sex,* Grade,* and Race/Ethnicity,* 2017 *M > F; 9th > 11th, 10th > 11th, 12th > 11th; B > H, B > W, H > W (Based on t-test analysis, p < 0.05.) All Hispanic students are included in the Hispanic category. All other races are non-Hispanic. Note: This graph contains weighted results. National Youth Risk Behavior Survey, 2017
Percentage of High School Students Who Had Sexual Intercourse for the First Time Before Age 13 Years, 1991-2017* *Decreased 1991-2017 [Based on linear and quadratic trend analyses using logistic regression models controlling for sex, race/ethnicity, and grade (p < 0.05). Significant linear trends (if present) across all available years are described first followed by linear changes in each segment of significant quadratic trends (if present).] Note: This graph contains weighted results. National Youth Risk Behavior Surveys, 1991-2017
Range and Median Percentage of High School Students Who Had Sexual Intercourse for the First Time Before Age 13 Years, Across 35 States and 20 Cities, 2017 State and Local Youth Risk Behavior Surveys, 2017
Percentage of High School Students Who Had Sexual Intercourse for the First Time Before Age 13 Years 2.1% - 2.7% 2.8% - 3.2% 3.3% - 3.7% 3.8% - 6.0% No Data State Youth Risk Behavior Surveys, 2017
Percentage of High School Students Who Had Sexual Intercourse with Four or More Persons During Their Life, by Sex,* Grade,* and Race/Ethnicity,* 2017 *M > F; 10th > 9th, 11th > 9th, 11th > 10th, 12th > 9th, 12th > 10th, 12th > 11th; B > H, B > W (Based on t-test analysis, p < 0.05.) All Hispanic students are included in the Hispanic category. All other races are non-Hispanic. Note: This graph contains weighted results. National Youth Risk Behavior Survey, 2017
Percentage of High School Students Who Had Sexual Intercourse with Four or More Persons During Their Life, 1991-2017* *Decreased 1991-2017 [Based on linear and quadratic trend analyses using logistic regression models controlling for sex, race/ethnicity, and grade (p < 0.05). Significant linear trends (if present) across all available years are described first followed by linear changes in each segment of significant quadratic trends (if present).] Note: This graph contains weighted results. National Youth Risk Behavior Surveys, 1991-2017
Range and Median Percentage of High School Students Who Had Sexual Intercourse with Four or More Persons During Their Life, Across 32 States and 19 Cities, 2017 State and Local Youth Risk Behavior Surveys, 2017
Percentage of High School Students Who Had Sexual Intercourse with Four or More Persons During Their Life 5.4% - 7.2% 7.3% - 8.8% 8.9% - 9.8% 9.9% - 12.7% No Data State Youth Risk Behavior Surveys, 2017
Percentage of High School Students Who Were Currently Sexually Active,* by Sex, Grade,† and Race/Ethnicity, 2017 *Had sexual intercourse with at least one person, during the 3 months before the survey †10th > 9th, 11th > 9th, 11th > 10th, 12th > 9th, 12th > 10th, 12th > 11th (Based on t-test analysis, p < 0.05.) All Hispanic students are included in the Hispanic category. All other races are non-Hispanic. Note: This graph contains weighted results. National Youth Risk Behavior Survey, 2017
Percentage of High School Students Who Were Currently Sexually Active,* 1991-2017† *Had sexual intercourse with at least one person, during the 3 months before the survey †Decreased 1991-2017, decreased 1991-2013, decreased 2013-2017 [Based on linear and quadratic trend analyses using logistic regression models controlling for sex, race/ethnicity, and grade (p < 0.05). Significant linear trends (if present) across all available years are described first followed by linear changes in each segment of significant quadratic trends (if present).] Note: This graph contains weighted results. National Youth Risk Behavior Surveys, 1991-2017
Range and Median Percentage of High School Students Who Were Currently Sexually Active,* Across 35 States and 19 Cities, 2017 *Had sexual intercourse with at least one person, during the 3 months before the survey State and Local Youth Risk Behavior Surveys, 2017
Percentage of High School Students Who Were Currently Sexually Active* 19.2% - 24.9% 25.0% - 26.2% 26.3% - 28.9% 29.0% - 33.5% No Data Had sexual intercourse with at least one person, during the 3 months before the survey State Youth Risk Behavior Surveys, 2017
Percentage of High School Students Who Used a Condom During Last Sexual Intercourse,* by Sex,† Grade,† and Race/Ethnicity, 2017 *Among students who were currently sexually active †M > F; 10th > 12th, 11th > 12th (Based on t-test analysis, p < 0.05.) All Hispanic students are included in the Hispanic category. All other races are non-Hispanic. Note: This graph contains weighted results. National Youth Risk Behavior Survey, 2017
Percentage of High School Students Who Used a Condom During Last Sexual Intercourse,* 1991-2017† *Among students who were currently sexually active †Increased 1991-2017, increased 1991-2005, decreased 2005-2017 [Based on linear and quadratic trend analyses using logistic regression models controlling for sex, race/ethnicity, and grade (p < 0.05). Significant linear trends (if present) across all available years are described first followed by linear changes in each segment of significant quadratic trends (if present).] Note: This graph contains weighted results. National Youth Risk Behavior Surveys, 1991-2017
Range and Median Percentage of High School Students Who Used a Condom During Last Sexual Intercourse,* Across 35 States and 19 Cities, 2017 *Among students who were currently sexually active State and Local Youth Risk Behavior Surveys, 2017
Percentage of High School Students Who Used a Condom During Last Sexual Intercourse* 42.7% - 50.9% 51.0% - 54.3% 54.4% - 57.5% 57.6% - 65.6% No Data Among students who were currently sexually active State Youth Risk Behavior Surveys, 2017
Percentage of High School Students Who Used Birth Control Pills Before Last Sexual Intercourse,* by Sex, Grade,† and Race/Ethnicity,† 2017 *To prevent pregnancy, among students who were currently sexually active †10th > 9th, 11th > 9th, 12th > 9th, 12th > 10th, 12th > 11th; W > B, W > H (Based on t-test analysis, p < 0.05.) All Hispanic students are included in the Hispanic category. All other races are non-Hispanic. Note: This graph contains weighted results. National Youth Risk Behavior Survey, 2017
Percentage of High School Students Who Used Birth Control Pills Before Last Sexual Intercourse,* 1991-2017† *To prevent pregnancy, among students who were currently sexually active †Increased 1991-2017, decreased 1991-1995, increased 1995-2017 [Based on linear and quadratic trend analyses using logistic regression models controlling for sex, race/ethnicity, and grade (p < 0.05). Significant linear trends (if present) across all available years are described first followed by linear changes in each segment of significant quadratic trends (if present).] Note: This graph contains weighted results. National Youth Risk Behavior Surveys, 1991-2017
Range and Median Percentage of High School Students Who Used Birth Control Pills Before Last Sexual Intercourse,* Across 33 States and 18 Cities, 2017 *To prevent pregnancy, among students who were currently sexually active State and Local Youth Risk Behavior Surveys, 2017
Percentage of High School Students Who Used Birth Control Pills Before Last Sexual Intercourse* 14.1% - 18.5% 18.6% - 21.1% 21.2% - 25.3% 25.4% - 34.8% No Data To prevent pregnancy, among students who were currently sexually active State Youth Risk Behavior Surveys, 2017
Percentage of High School Students Who Used an IUD (e.g., Mirena or Paragard) or Implant (e.g., Implanon or Nexplanon),* by Sex,† Grade, and Race/Ethnicity,† 2017 *Before last sexual intercourse to prevent pregnancy among students who were currently sexually active †F > M; W > H (Based on t-test analysis, p < 0.05.) All Hispanic students are included in the Hispanic category. All other races are non-Hispanic. Note: This graph contains weighted results. National Youth Risk Behavior Survey, 2017
Percentage of High School Students Who Used an IUD (e.g., Mirena or Paragard) or Implant (e.g., Implanon or Nexplanon),* 2013-2017† *Before last sexual intercourse to prevent pregnancy among students who were currently sexually active †Increased 2013-2017 [Based on linear trend analyses using logistic regression models controlling for sex, race/ethnicity, and grade (p < 0.05).] Note: This graph contains weighted results. National Youth Risk Behavior Surveys, 2013-2017
Range and Median Percentage of High School Students Who Used an IUD (e.g., Mirena or Paragard) or Implant (e.g., Implanon or Nexplanon),* Across 33 States and 18 Cities, 2017 *Before last sexual intercourse to prevent pregnancy among students who were currently sexually active State and Local Youth Risk Behavior Surveys, 2017
Percentage of High School Students Who Used an IUD (e.g., Mirena or Paragard) or Implant (e.g., Implanon or Nexplanon)* 1.9% - 3.6% 3.7% - 4.9% 5.0% - 7.6% 7.7% - 13.3% No Data Before last sexual intercourse to prevent pregnancy among students who were currently sexually active State Youth Risk Behavior Surveys, 2017
Percentage of High School Students Who Used a Shot (e.g., Depo-Provera), Patch (e.g., Orthoevra), or Birth Control Ring (e.g., Nuvaring),* by Sex,† Grade,† and Race/Ethnicity,† 2017 *Before last sexual intercourse to prevent pregnancy among students who were currently sexually active †F > M; 11th > 10th; B > H, W > H (Based on t-test analysis, p < 0.05.) All Hispanic students are included in the Hispanic category. All other races are non-Hispanic. Note: This graph contains weighted results. National Youth Risk Behavior Survey, 2017
Percentage of High School Students Who Used a Shot (e.g., Depo-Provera), Patch (e.g., Orthoevra), or Birth Control Ring (e.g., Nuvaring),* 2013-2017† *Before last sexual intercourse to prevent pregnancy among students who were currently sexually active †No change 2013-2017 [Based on linear trend analyses using logistic regression models controlling for sex, race/ethnicity, and grade (p < 0.05).] Note: This graph contains weighted results. National Youth Risk Behavior Surveys, 2013-2017
Range and Median Percentage of High School Students Who Used a Shot (e.g., Depo-Provera), Patch (e.g., Orthoevra), or Birth Control Ring (e.g., Nuvaring),* Across 33 States and 18 Cities, 2017 *Before last sexual intercourse to prevent pregnancy among students who were currently sexually active State and Local Youth Risk Behavior Surveys, 2017
Percentage of High School Students Who Used a Shot (e.g., Depo-Provera), Patch (e.g., Orthoevra), or Birth Control Ring (e.g., Nuvaring)* 2.1% - 3.6% 3.7% - 4.6% 4.7% - 6.0% 6.1% - 7.9% No Data Before last sexual intercourse to prevent pregnancy among students who were currently sexually active State Youth Risk Behavior Surveys, 2017
Percentage of High School Students Who Used Birth Control Pills; an IUD or Implant; or a Shot, Patch, or Birth Control Ring,* by Sex,† Grade,† and Race/Ethnicity,† 2017 *Before last sexual intercourse to prevent pregnancy among students who were currently sexually active †F > M; 10th > 9th, 11th > 9th, 11th > 10th, 12th > 9th, 12th > 10th, 12th > 11th; B > H, W > B, W > H (Based on t-test analysis, p < 0.05.) All Hispanic students are included in the Hispanic category. All other races are non-Hispanic. Note: This graph contains weighted results. National Youth Risk Behavior Survey, 2017
Percentage of High School Students Who Used Birth Control Pills; an IUD or Implant; or a Shot, Patch, or Birth Control Ring,* 2013-2017† *Before last sexual intercourse to prevent pregnancy among students who were currently sexually active †Increased 2013-2017 [Based on linear trend analyses using logistic regression models controlling for sex, race/ethnicity, and grade (p < 0.05).] Note: This graph contains weighted results. National Youth Risk Behavior Surveys, 2013-2017
Range and Median Percentage of High School Students Who Used Birth Control Pills; an IUD or Implant; or a Shot, Patch, or Birth Control Ring,* Across 33 States and 18 Cities, 2017 *Before last sexual intercourse to prevent pregnancy among students who were currently sexually active State and Local Youth Risk Behavior Surveys, 2017
Percentage of High School Students Who Used Birth Control Pills; an IUD or Implant; or a Shot, Patch, or Birth Control Ring* 20.9% - 30.2% 30.3% - 33.0% 33.1% - 36.8% 36.9% - 50.2% No Data Before last sexual intercourse to prevent pregnancy among students who were currently sexually active State Youth Risk Behavior Surveys, 2017
Percentage of High School Students Who Used Both a Condom During and Birth Control Pills; an IUD or Implant; or a Shot, Patch, or Birth Control Ring Before Last Sexual Intercourse,* by Sex, Grade, and Race/Ethnicity,† 2017 *To prevent pregnancy among students who were currently sexually active †W > B, W > H (Based on t-test analysis, p < 0.05.) All Hispanic students are included in the Hispanic category. All other races are non-Hispanic. Note: This graph contains weighted results. National Youth Risk Behavior Survey, 2017
Percentage of High School Students Who Used Both a Condom During and Birth Control Pills; an IUD or Implant; or a Shot, Patch, or Birth Control Ring Before Last Sexual Intercourse,* 2013-2017† *To prevent pregnancy among students who were currently sexually active †No change 2013-2017 [Based on linear trend analyses using logistic regression models controlling for sex, race/ethnicity, and grade (p < 0.05).] Note: This graph contains weighted results. National Youth Risk Behavior Surveys, 2013-2017
Range and Median Percentage of High School Students Who Used Both a Condom During and Birth Control Pills; an IUD or Implant; or a Shot, Patch, or Birth Control Ring Before Last Sexual Intercourse,* Across 33 States and 18 Cities, 2017 *To prevent pregnancy among students who were currently sexually active State and Local Youth Risk Behavior Surveys, 2017
Percentage of High School Students Who Used Both a Condom During and Birth Control Pills; an IUD or Implant; or a Shot, Patch, or Birth Control Ring Before Last Sexual Intercourse* 5.5% - 9.1% 9.2% - 11.1% 11.2% - 13.2% 13.3% - 18.9% No Data To prevent pregnancy among students who were currently sexually active State Youth Risk Behavior Surveys, 2017
Percentage of High School Students Who Did Not Use Any Method to Prevent Pregnancy,* by Sex,† Grade,† and Race/Ethnicity,† 2017 *During last sexual intercourse among students who were currently sexually active †F > M; 9th > 11th, 9th > 12th; B > W, H > W (Based on t-test analysis, p < 0.05.) All Hispanic students are included in the Hispanic category. All other races are non-Hispanic. Note: This graph contains weighted results. National Youth Risk Behavior Survey, 2017
Percentage of High School Students Who Did Not Use Any Method to Prevent Pregnancy,* 1991-2017† *During last sexual intercourse among students who were currently sexually active †Decreased 1991-2017, decreased 1991-2007, no change 2007-2017 [Based on linear and quadratic trend analyses using logistic regression models controlling for sex, race/ethnicity, and grade (p < 0.05). Significant linear trends (if present) across all available years are described first followed by linear changes in each segment of significant quadratic trends (if present).] Note: This graph contains weighted results. National Youth Risk Behavior Surveys, 1991-2017
Range and Median Percentage of High School Students Who Did Not Use Any Method to Prevent Pregnancy,* Across 33 States and 18 Cities, 2017 *During last sexual intercourse among students who were currently sexually active State and Local Youth Risk Behavior Surveys, 2017
Percentage of High School Students Who Did Not Use Any Method to Prevent Pregnancy* 6.6% - 10.1% 10.2% - 13.2% 13.3% - 15.7% 15.8% - 23.1% No Data During last sexual intercourse among students who were currently sexually active State Youth Risk Behavior Surveys, 2017
Percentage of High School Students Who Drank Alcohol or Used Drugs Before Last Sexual Intercourse,* by Sex,† Grade,† and Race/Ethnicity, 2017 *Among students who were currently sexually active †M > F; 10th > 11th, 12th > 11th (Based on t-test analysis, p < 0.05.) All Hispanic students are included in the Hispanic category. All other races are non-Hispanic. Note: This graph contains weighted results. National Youth Risk Behavior Survey, 2017
Percentage of High School Students Who Drank Alcohol or Used Drugs Before Last Sexual Intercourse,* 1991-2017† *Among students who were currently sexually active †Decreased 1991-2017, increased 1991-1999, decreased 1999-2017 [Based on linear and quadratic trend analyses using logistic regression models controlling for sex, race/ethnicity, and grade (p < 0.05). Significant linear trends (if present) across all available years are described first followed by linear changes in each segment of significant quadratic trends (if present).] Note: This graph contains weighted results. National Youth Risk Behavior Surveys, 1991-2017
Range and Median Percentage of High School Students Who Drank Alcohol or Used Drugs Before Last Sexual Intercourse,* Across 35 States and 18 Cities, 2017 *Among students who were currently sexually active State and Local Youth Risk Behavior Surveys, 2017
Percentage of High School Students Who Drank Alcohol or Used Drugs Before Last Sexual Intercourse* 13.7% - 16.5% 16.6% - 18.1% 18.2% - 19.8% 19.9% - 22.8% No Data Among students who were currently sexually active State Youth Risk Behavior Surveys, 2017
Percentage of High School Students Who Were Ever Tested for Human Immunodeficiency Virus (HIV),* by Sex,† Grade,† and Race/Ethnicity,† 2017 *Not counting tests done if they donated blood †F > M; 10th > 9th, 11th > 9th, 11th > 10th, 12th > 9th, 12th > 10th, 12th > 11th; B > H, B > W (Based on t-test analysis, p < 0.05.) All Hispanic students are included in the Hispanic category. All other races are non-Hispanic. Note: This graph contains weighted results. National Youth Risk Behavior Survey, 2017