Download
1 / 60
600 likes | 617 Views
Explore risky behaviors among 8th graders from the 2004 YRBS survey and trends in unintentional injuries, violence, substance use, and mental health. Identify areas for improvement and targeted interventions.

E N D
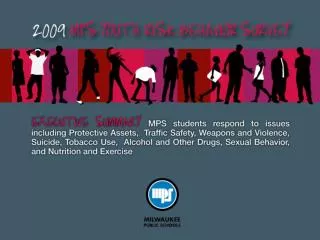
Youth Risk Behavior Survey (YRBS)Pollard Middle School2004 Student Risky Behaviors
Purpose • To focus attention on specific behaviors that result in death and injury among teens and young adults • To assess whether those behaviors change overtime • To provide comparable data
2004 MS YRBSN = 348 8th Grade Students w/Comparison Data • 8th Graders 2000 • 8th Graders 2002
Six Categories that have been identified as Risky Behaviors • Unintentional Injury & Violence • Tobacco Use • Alcohol and Other Drug Use • Sexual Behaviors • Dietary Behaviors • Physical Inactivity
2003 MS YRBS • Unintentional Injury & Violence • Seat Belts • Helmets • Riding with Someone under the Influence of Alcohol • Weapons • Physical Fights • Bullying • Depression • Suicide
Key • Red = High • Mint Green = Low
Unintentional Injury & ViolenceSeat Belt & Helmet Use 00 02 04 Seat Belt77% 81%79% Bicycle Helmet44%43%42% Roller Blade25% 27%18% Skateboard Helmet
Unintentional Injury & ViolenceVehicle Safety 00 02 04 • Ridden in a car driven by someone 22% 27%18% who had been drinking alcohol
Unintentional Injury & Violence • Females more likely to wear a seat belt across all three surveys • Females use of seat belts has improved over time • Females more likely to wear a bike helmet
Unintentional Injury & ViolenceVehicle Safety • No difference between males and females riding in car driven by someone under the influence
Unintentional Injury & ViolenceWeapons & Physical Fights 00 02 04 • Carried a weapon 21%14% 16% • Physical Fights 58% 48% 44% • Fights w/Medical 09% 06% 04%
Unintentional Injury & ViolenceWeapons Decrease in reports of carrying a weapon More MS students report carrying a weapon than HS students More males report carrying a weapon
Unintentional Injury & ViolencePhysical Fights • Decrease in the number of physical fights over time • Males more apt to be in physical fights
Unintentional Injury & ViolenceBullying 00 02 04 • Bullied or Harassed ---- 19% 19%
Unintentional Injury & ViolenceBullied or Harassed 2002 1) Hallways (before & after school) 37% 2) Hallways (between classes) 25% 3) Cafeteria 12% 2004 1) Hallways (between classes) 28% 2) Cafeteria 25% 3) Hallways (before and after classes) 22%
Unintentional Injury & ViolenceBullying & Harassment • Has remained consistent over time • Most likely to occur in 6th grade • Males most likely to report
Unintentional Injury & ViolenceDepression & Suicide 00 02 04 •Thoughts 18% 20%12% • Made a plan 11% 14%10% • Have tried 05% 06%04%
Unintentional Injury & ViolenceDepression & Suicide Lowest % for all categories MS Data is consistent with HS Data Serious for both males & females
ImprovementsUnintentional Injuries • Fewer students have ridden in a car driven by someone under the influence • Fewer Physical Fights • Depression and thoughts of death are on the decline. • Fewer students carrying weapons
Areas of Focus • Fewer students wearing seatbelts • Fewer students wearing helmets
Seat Belt Use • Signs for areas where parents pick up their children to remind them to “BUCKLE-UP”
Helmet Use • Working with the Massachusetts Head Injury Prevention Association to learn more about what can be done to encourage helmet use
2003 MS YRBS • Tobacco Use
Tobacco Use 00 02 04 •Tried Cigarette 27%20%09% • Regular Use 09%07% 08% • Smokeless 14% 04% 03% • Cigar Use 13% 08% 04%
Have tried a cigarette • Most 8th Graders have not (91%) • Of those who have…half male & half female
HS YRBS Trends suggest that students are most apt to have their first cigarette in middle school • 1995 59% 2001 59% • 1997 61% 2003 46% • 1999 64%
Improvements • Most MS students (91%) have not tried a cigarette • Use of all tobacco products are at an all time low (cigarettes, cigars and smokeless tobacco) • Fewer students are trying cigarettes for the first time in MS
Area of Focus • 9% (31 students) have tried cigarettes 8% identify as regular users Find these kids and provide intervention
2003 MS YRBS • Alcohol and Other Drug Use
Alcohol Use 00 02 04 • Have Had Alcohol40%37%31% •First Drink Age 10 or Younger37%30%21%
Alcohol Use Trends • The % of students reporting that they have consumed alcohol has declined over time • Males more likely to have had a drink • Males more likely to have had first drink in elementary school
HS YRBS trends suggest that students are most apt to have their first drink of alcohol in middle school • 1995 59% 2001 57% • 1997 54%2003 53% • 1999 56%
Other Drug Use 00 02 04 • Marijuana Use16% 12% 09% • Cocaine Use04%03%03% •Inhalants 08%07%08% • Steroid Use 02%01% 01% • Injected Illegal Drug 02% 02% 02%
Trends • Marijuana use is at all time low in middle school • Decrease in use by MS males • Increase in use by MS females • HS data reveal that 25% of those who use try marijuana for the first time in MS
HS YRBS trends suggest that most students do not use other drugs Cocaine 05% (04% - 05%) Inhalants 04% (04% - 12%) Steroid Use 02% (02% - 06%) Injected/Illegal Drug 02% (01% - 15%) Hallucinogenic Drugs 11% (09% - 15%) Heroin 02% (02% - 10%) * Ecstasy 06% ( *No Data )
Improvements • The percentage of students who report they have used alcohol has declined • Students who have had a drink, waited until they were older to have their first drink • Other drug use has declined or remained the same
Area of Focus Marijuana use among MS students has declined The 2003 HS data reveal that the percentage of students who have tried marijuana at least once has increased by 22 percentage points Work with law enforcement to monitor marijuana use in community
2003 MS YRBS • Sexual Behaviors
Sexual BehaviorAbstinence Most MS students have not had sexual intercourse 89% Most HS students have not had sexual intercourse 74% (2003)
Sexual Behavior 00 02 04 • Have had sexual intercourse 12%13%09% • Female % remained consistent • Male % decreased over time • Of those who have - 60% report that they or their partner used a condom
Sexual Behavior 00 02 04 • Have had oral sex ---- ---- 15% (51 Students) • Almost half (22 students) reported 2 or more partners • Males more likely than females
HS YRBS trends suggest that of those students who have had sexual intercourse……they are most apt to have sexual intercourse for the first time in high school
Data is Consistent • Most MS students (89%) have not had sexual intercourse • This percentage has remained consistent over time
Areas of Focus • Find ways to encourage parents to talk (and continue to talk) to their children • Continue parent interviews as part of homework in health education • Continue the 5th grade health unit on puberty
MS YRBS Monitors 6 Behaviors • Dietary Behaviors
Dietary Behaviors & Weight Control 00 02 04 Right Weight55%51%54% Trying to Lose40% 40%39% • Consistent with HS data
Dietary Behaviors • Almost twice as many females reported that they are trying to lose weight across all three surveys • Consistently about half of all 8th grade girls are trying to lose weight
Dietary Behaviors & Weight ControlHealthy Weight Control 00 02 04 • Exercise 71%60% 61% • Fewer Calories 50% 47% 44%
Dietary Behaviors & Weight ControlUnhealthy Weight Control 00 02 04 • Gone w/out eating16% 11%10% • Pills/powders05%03%02% • Vomited/laxatives06%04%05%
Dietary Behaviors • NOTE: It is not clear how many students might by combining both healthy and unhealthy methods of weight loss