Download
1 / 11
110 likes | 219 Views
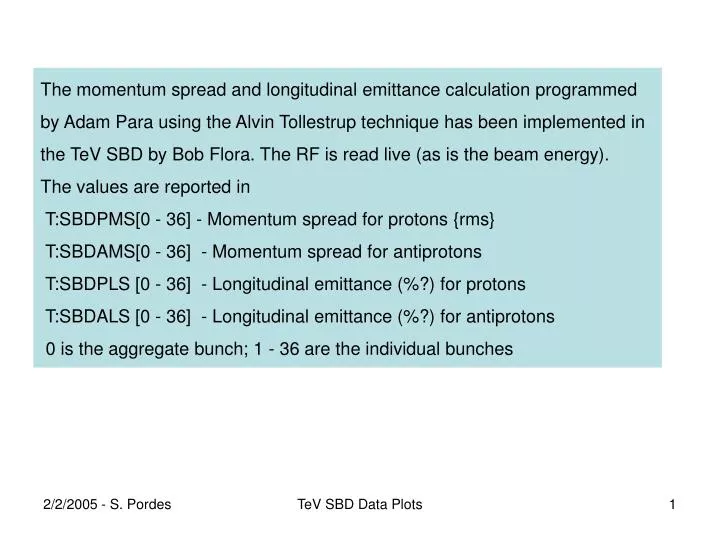
The momentum spread and longitudinal emittance calculation programmed by Adam Para using the Alvin Tollestrup technique has been implemented in the TeV SBD by Bob Flora. The RF is read live (as is the beam energy). The values are reported in

E N D
The momentum spread and longitudinal emittance calculation programmed by Adam Para using the Alvin Tollestrup technique has been implemented in the TeV SBD by Bob Flora. The RF is read live (as is the beam energy). The values are reported in T:SBDPMS[0 - 36] - Momentum spread for protons {rms} T:SBDAMS[0 - 36] - Momentum spread for antiprotons T:SBDPLS [0 - 36] - Longitudinal emittance (%?) for protons T:SBDALS [0 - 36] - Longitudinal emittance (%?) for antiprotons 0 is the aggregate bunch; 1 - 36 are the individual bunches TeV SBD Data Plots
proton bunchlength pbar bunchlength proton RF pbar RF proton dp/p pbar dp/p Tevatron SBD outputs for store 3953, including RF trip TeV SBD Data Plots
pbar bunchlength proton bunchlength pbar dp/p proton dp/p pbar emittance proton emittance beam energy beam energy Plots of emittance and momentum spread before and after ramp showing that the emittance reported does not change much between 150 and 980; TeV SBD Data Plots
SBD parameters during store 3953 proton bunch length pbar bunch length pbar emittance proton emittance proton dp/p pbar dp/p Note: AS POINTED OUT BY V. SHILTSEV, THE EMITTANCES CANNOT CHANGE AS SHOWN. THERE WAS A BUG AT THIS TIME - SEE NEXT. TeV SBD Data Plots
After the problem with the emittances changing when the RF tripped was pointed out, a bug was found and corrected in the code and the changes in emittance reported when another RF trip occurred have been removed. (The bug would only show up when the RF was not at the nominal value.) TeV SBD Data Plots
ACNet Displays of bunchlength and dp/p arrays (D27) proton bunches 1 - 36 bunchlength dp/p Proton bunchlength and momentum spread arrays TeV SBD Data Plots
pbar bunches 1 - 36 dp/p bunchlength Antiproton bunchlength and momentum-spread arrays TeV SBD Data Plots
Preparations for the OAC: Step 1: Transfer bunch profile data from TeV SBD via ACNET T:SBDPBS[0 - 3514] is array of 95 samples (@ 5 GHz) for 37 proton bunches T:SBDABS[0 - 3514] is array of 95 samples (@ 5 GHz) for 37 antiproton bunches aggregate bunch aggregate bunch pbar bunches 1 - 36 proton bunches 1 - 36 TeV SBD Data Plots
TeV SBD Bunch Signal Data for OAC Aggregate 36 Bunches TeV SBD Data Plots
pbar Aggregate Bunch Signal Data Proton Aggregate Bunch Signal Data 200 pS Samples 200 pS Samples Mean Centered Mean Centered TeV SBD Data Plots
Every 30 Minutes Successive (each 30 minutes) antiproton aggregates; The hole is when the RF tripped and the bunchlength jumped TeV SBD Data Plots