Download
1 / 1
10 likes | 127 Views
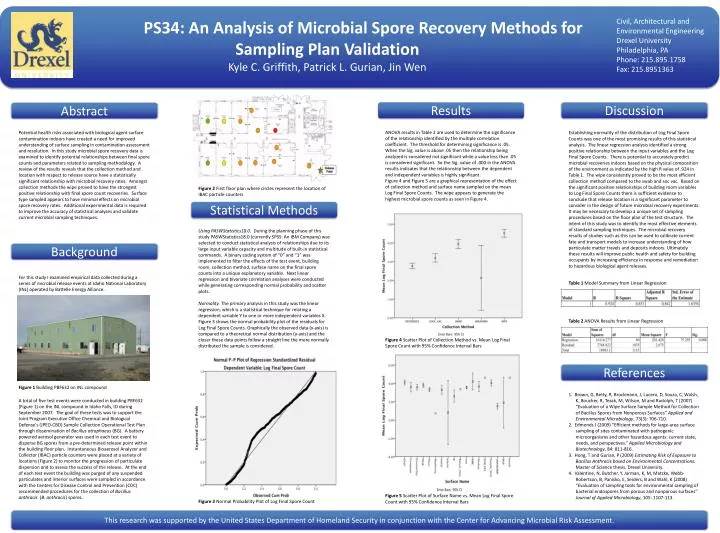
PS34: An Analysis of Microbial Spore Recovery Methods for Sampling Plan Validation Kyle C. Griffith, Patrick L. Gurian, Jin Wen. Civil, Architectural and Environmental Engineering Drexel University Philadelphia, PA Phone: 215.895.1758 Fax: 215.8951363. Results. Discussion. Abstract.

E N D
PS34: An Analysis of Microbial Spore Recovery Methods for Sampling Plan Validation Kyle C. Griffith, Patrick L. Gurian, Jin Wen Civil, Architectural and Environmental Engineering Drexel University Philadelphia, PA Phone: 215.895.1758 Fax: 215.8951363 Results Discussion Abstract ANOVA results in Table 2 are used to determine the significance of the relationship identified by the multiple correlation coefficient. The threshold for determining significance is .05. When the Sig. value is above .05 then the relationship being analyzed is considered not significant while a value less than .05 is considered significant. So the Sig. value of .000 in the ANOVA results indicates that the relationship between the dependent and independent variables is highly significant. Figure 4 and Figure 5 are a graphical representation of the effect of collection method and surface name sampled on the mean Log Final Spore Counts. The wipe appears to generate the highest microbial spore counts as seen in Figure 4. Establishing normality of the distribution of Log Final Spore Counts was one of the most promising results of this statistical analysis. The linear regression analysis identified a strong positive relationship between the input variables and the Log Final Spore Counts. There is potential to accurately predict microbial recoveries indoors based on the physical composition of the environment as indicated by the high R value of .924 in Table 1. The wipe consistently proved to be the most efficient collection method compared to the swab and soc vac. Based on the significant positive relationships of building room variables to Log Final Spore Counts there is sufficient evidence to conclude that release location is a significant parameter to consider in the design of future microbial recovery experiments. It may be necessary to develop a unique set of sampling procedures based on the floor plan of the test structure. The intent of this study was to identify the most effective elements of standard sampling techniques. The microbial recovery results of studies such as this can be used to calibrate current fate and transport models to increase understanding of how particulate matter travels and deposits indoors. Ultimately these results will improve public health and safety for building occupants by increasing efficiency in response and remediation to hazardous biological agent releases. Potential health risks associated with biological agent surface contamination indoors have created a need for improved understanding of surface sampling in contamination assessment and resolution. In this study microbial spore recovery data is examined to identify potential relationships between final spore counts and parameters related to sampling methodology. A review of the results reveals that the collection method and location with respect to release source have a statistically significant relationship with microbial recovery rates. Amongst collection methods the wipe proved to have the strongest positive relationship with final spore count recoveries. Surface type sampled appears to have minimal effects on microbial spore recovery rates. Additional experimental data is required to improve the accuracy of statistical analyses and validate current microbial sampling techniques. Figure 2 First floor plan where circles represent the location of IBAC particle counters Statistical Methods Using PASWStatistics18.0. During the planning phase of this study PASWStatistics18.0 (currently SPSS: An IBM Company) was selected to conduct statistical analysis of relationships due to its large input variable capacity and multitude of built-in statistical commands. A binary coding system of “0” and “1” was implemented to filter the effects of the test event, building room, collection method, surface name on the final spore counts into a unique explanatory variable. Next linear regression and bivariate correlation analyses were conducted while generating corresponding normal probability and scatter plots. Normality. The primary analysis in this study was the linear regression, which is a statistical technique for relating a dependent variable Y to one or more independent variables X. Figure 3 shows the normal probability plot of the residuals for Log Final Spore Counts. Graphically the observed data (x-axis) is compared to a theoretical normal distribution (y-axis) and the closer these data points follow a straight line the more normally distributed the sample is considered. Background For this study I examined empirical data collected during a series of microbial release events at Idaho National Laboratory (INL) operated by Battelle Energy Alliance. Table 1 Model Summary from Linear Regression Table 2 ANOVA Results from Linear Regression Figure 4 Scatter Plot of Collection Method vs. Mean Log Final Spore Count with 95% Confidence Interval Bars References Figure 1 Building PBF632 on INL compound 1. Brown, G, Betty, R, Brockmann, J, Lucero, D, Souza, C, Walsh, K, Boucher, R, Tezak, M, Wilson, M and Rudolph, T (2007) “Evaluation of a Wipe Surface Sample Method for Collection of Bacillus Spores from Nonporous Surfaces” Applied and Environmental Microbiology, 73(3): 706-710. 2. Edmonds J (2009) “Efficient methods for large-area surface sampling of sites contaminated with pathogenic microorganisms and other hazardous agents: current state, needs, and perspectives.” Applied Microbiology and Biotechnology, 84: 811-816. 3. Hong, T and Gurian, P (2009) Estimating Risk of Exposure to Bacillus Anthracis based on Environmental Concentrations. Master of Science thesis, Drexel University. 4. Valentine, N, Butcher, Y, Jarman, K, M, Matzke, Webb-Robertson, B, Panisko, E, Seiders, B and Wahl, K (2008) “Evaluation of sampling tools for environmental sampling of bacterial endospores from porous and nonporous surfaces” Journal of Applied Microbiology, 105: 1107-113. A total of five test events were conducted in building PBF632 (Figure 1) on the INL compound in Idaho Falls, ID during September 2007. The goal of these tests was to support the Joint Program Executive Office Chemical and Biological Defense's (JPEO-CBD) Sample Collection Operational Test Plan through dissemination of Bacillus atrophaeus (BG). A battery powered aerosol generator was used in each test event to disperse BG spores from a pre-determined release point within the building floor plan. Instantaneous Bioaerosol Analyzer and Collector (IBAC) particle counters were placed at a variety of locations (Figure 2) to monitor the progression of particulate dispersion and to assess the success of the release. At the end of each test event the building was purged of any suspended particulates and interior surfaces were sampled in accordance with the Centers for Disease Control and Prevention (CDC) recommended procedures for the collection of Bacillus anthracis (B. anthracis) spores. Figure 5 Scatter Plot of Surface Name vs. Mean Log Final Spore Count with 95% Confidence Interval Bars Figure 3 Normal Probability Plot of Log Final Spore Count This research was supported by the United States Department of Homeland Security in conjunction with the Center for Advancing Microbial Risk Assessment.