Download
1 / 49
490 likes | 563 Views
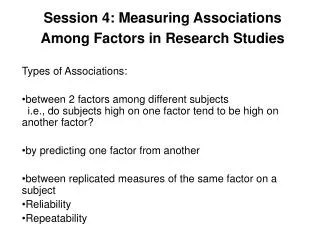
Determining and Interpreting Associations Among Variables. Associative Analyses. Associative analyses: determine where stable relationships exist between two variables Examples What methods of doing business are associated with level of customer satisfaction?

E N D
Associative Analyses • Associative analyses:determine where stable relationships exist between two variables • Examples • What methods of doing business are associated with level of customer satisfaction? • What demographic variables are associated with repeat buying of Brand A? • Is type of sales training associated with sales performance of sales representatives? • Are purchase intention scores of a new product associated with actual sales of the product?
Relationships Between Two Variables • Relationship:a consistent, systematic linkage between the levels or labels for two variables • “Levels” refers to the characteristics of description for interval or ratio scales…the level of temperature, etc. • “Labels” refers to the characteristics of description for nominal or ordinal scales, buyers v. non-buyers, etc. • As we shall see, this concept is important in understanding the type of relationship…
Relationships Between Two Variables • Nonmonotonic:two variables are associated, but only in a very general sense; don’t know “direction” of relationship, but we do know that the presence (or absence) of one variable is associated with the presence (or absence) of another. • At the presence of breakfast, we shall have the presence of orders for coffee. • At the presence of lunch, we shall have the absence of orders for coffee.
Relationships Between Two Variables • Monotonic:the general direction of a relationship between two variables is known • Increasing • Decreasing • Shoe store managers know that there is an association between the age of a child and shoe size. The older a child, the larger the shoe size. The direction is increasing, though we only know general direction, not actual size.
Relationships Between Two Variables • Linear:“straight-line” association between two variables • Here knowledge of one variable will yield knowledge of another variable • “100 customers produce $500 in revenue at Jack-in-the-Box” (p. 525)
Relationships Between Two Variables • Curvilinear:some smooth curve pattern describes the association • Example: Research shows that job satisfaction is high when one first starts to work for a company but goes down after a few years and then back up after workers have been with the same company for many years. This would be a U-shaped relationship.
Characterizing Relationships Between Variables • Presence:whether any systematic relationship exists between two variables of interest • Direction:whether the relationship is positive or negative • Strength of association: how strong the relationship is: strong? moderate? weak? • Assess relationships in the order shown above.
Cross-Tabulations • Cross-tabulation:consists of rows and columns defined by the categories classifying each variable…used for nonmonotonic relationships • Cross-tabulation table: four types of numbers in each cell • Frequency • Raw percentage • Column percentage • Row percentage
Cross-Tabulations • Using SPSS, commands are ANALYZE, DESCRIPTIVE STATISTICS, CROSSTABS • You will find a detailed discussion of cross-tabulation tables in your text, pages 528-531.
Cross-Tabulations • When we have two nominal-scaled variables and we want to know if they are associated, we use cross-tabulations to examine the relationship and the Chi-Square test to test for presence of a systematic relationship. • In this situation: two variables, both with nominal scales, we are testing for a nonmonotonic relationship.
Chi-Square Analysis • Chi-square (X2) analysis: is the examination of frequencies for two nominal-scaled variables in a cross-tabulation table to determine whether the variables have a significant relationship. • The null hypothesis is that the two variables are not related. • Observed and expected frequencies:
Cross-Tabulations • Example: Let’s suppose we want to know if there is a relationship between studying and test performance and both of these variables are measured using nominal scales…
Interpreting a Significant Cross-Tabulation Finding • If the chi-square analysis determines that you have a significant relationship (no support for the null hypothesis) you may use the following to determine the nature of the relationship: • The column percentages table or • The raw percentages table
Cross-Tabulations • Did you study for the midterm test? __yes __no • How did you perform on the midterm test? __pass __fail • Now, let’s look at the data in a crosstabulation table:
Cross-Tabulations • Do you “see” a relationship? Do you “see” the “presence” of studying with the “presence” of passing? Do you “see” the “absence” of passing with the presence of not studying? • Congratulations! You have just “seen” a nonmonotonic relationship.
Cross-Tabulations • Bar charts can be used to “see” nonmonotonic relationships.
Cross-Tabulations • But while we can “see” this association, how do we know there is the presence of a systematic association? In other words, is this association statistically significant? Would it likely appear again and again if we sampled other students? • We use the Chi-Square test to tell us if nonmonotonic relationships are really present.
Cross-Tabulations • Using SPSS, commands are ANALYZE, DESCRIPTIVE STATISTICS, CROSSTABS and within the CROSSTABS dialog box, STATISTICS, CHI-SQUARE.
Chi-Square Analysis • Chi-square analysis:assesses nonmonotonic associations in cross-tabulation tables and is based upon differences between observed and expected frequencies • Observed frequencies: counts for each cell found in the sample • Expected frequencies: calculated on the null of “no association” between the two variables under examination
Chi-Square Analysis • Computed Chi-Square values:
Chi-Square Analysis • The chi-square distribution’s shape changes depending on the number of degrees of freedom • The computed chi-square value is compared to a table value to determine statistical significance
Chi-Square Analysis • How do I interpret a Chi-square result? • The chi-square analysis yields the probability that the researcher would find evidence in support of the null hypothesis if he or she repeated the study many, many times with independent samples. • If the P value is < or = to 0.05, this means there is little support for the null hypothesis (no association). Therefore, we have a significant association…we have the PRESENCE of a systematic relationship between the two variables.
Chi-Square Analysis • Read the P value (Asympt. Sig) across from Pearson Chi-Square. Since the P value is <0.05, we have a SIGNIFICANT association.
Chi-Square Analysis • How do I interpret a Chi-square result? • A significant chi-square result means the researcher should look at the cross-tabulation row and column percentages to “see” the association pattern • SPSS will calculate row, column, (or both) percentages for you. See the CELLS box at the bottom of the CROSSTABS dialog box.
Chi-Square Analysis • Look at the ROW %’s: 92% of those who studied passed; almost 70% of those who didn’t study failed. “See” the relationship!
Presence, Direction and Strength • Presence? Yes, our Chi-Square was significant. This means that the pattern we observe between studying/not studying and passing/failing is a systematic relationship if we ran our study many, many times. • Direction? Nonmonotonic relationships do not have direction…only presence and absence.
Presence, Direction and Strength • Strength? Since the Chi-Square only tells us presence, you must judge the strength by looking at the pattern. Don’t you think there is a “strong” relationship between study/not studying and passing/failing?
When can you use Crosstabs and Chi-Square test? • When you want to know if there is an association between two variables and… • Both of those variables have nominal (or ordinal) scales
Correlation Coefficients and Covariation • The correlation coefficient: is an index number, constrained to fall between the range of −1.0 and +1.0. • The correlation coefficient communicates both the strength and the direction of the linear relationship between two metric variables.
Correlation Coefficients and Covariation • The amount of linear relationship between two variables is communicated by the absolute size of the correlation coefficient. • The direction of the association is communicated by the sign (+, -) of the correlation coefficient. • Covariation: is defined as the amount of change in one variable systematically associated with a change in another variable.
Measuring the Association Between Interval- or Ratio-Scaled Variables • In this case, we are trying to assess presence, direction and strength of a monotonic relationship. • We are aided in doing this by using: • Using SPSS, commands are ANALYZE, CORRELATE, BIVARIATE. Pearson Product Moment Correlation
Correlation Coefficients and Covariation • Covariation can be examined with use of a scatter diagram.
Pearson Product Moment Correlation Coefficient (r) • Presence? Determine if there is a significant association. The P value should be examined FIRST! If it is significant, there is a significant association. If not, there is no association. • Direction? Look at the coefficient. Is it positive or negative?
Pearson Product Moment Correlation Coefficient (r) • Strength? The correlation coefficient (r) is a number ranging from -1.0 to +1.0. the closer to 1.00 (+ or -), the stronger the association. There are “rules of thumb”…
Rules of Thumb Determining Strength of Association • A correlation coefficient’s size indicates the strength of association between two variables. • The sign (+ or -) indicates the direction of the association
Pearson Product Moment Correlation Coefficient (r) • Pearson product moment correlation: measures the degree of linear association between the two variables.
Pearson Product Moment Correlation Coefficient (r) • Special considerations in linear procedures: • Correlation takes into account only the relationship between two variables, not interaction with other variables. • Correlation does not demonstrate cause and effect. • Correlations will not detect non-linear relationships between variables.
When there is NO association, the P value for the Pearson r will be >0.05.
When there IS association, the P value for the Pearson r will be < or =0.05. • Examples: negative association between sales force rewards and turnover; positive association between length of sales force training and sales.
Example • What items are associated with preference for a waterfront view among restaurant patrons? • Are preferences for unusual entrées, simple décor, and unusual desserts associated with preference for waterfront view while dining? • Since all of these variables are interval-scaled we can run a Pearson Correlation to determine the association between each variable with the preference for waterfront view.
The output shows presence, direction and strength of the association. • Do you see any managerial significance to these associations?
Concluding Remarks on Associative Analyses • Researchers will always test the null hypothesis of NO relationship or no correlation. • When the null hypothesis is rejected, then the researcher may have a managerially important relationship to share with the manager.