Download
1 / 11
130 likes | 436 Views
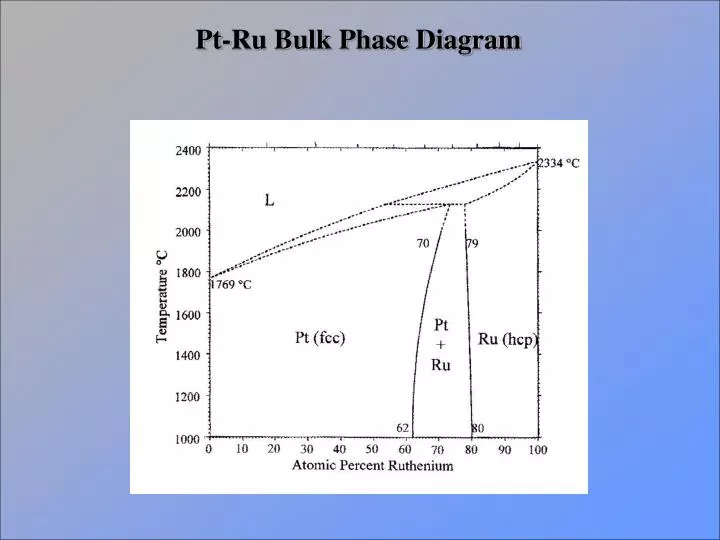
Pt-Ru Bulk Phase Diagram. H 2. +. 673 K. Supported Metal Nanoparticle. Metal Salt Precursor. ?. Pt/C + RuCl 3 •3H 2 O. [Pt x Ru y ]/C. Ru/C + H 2 PtCl 6 • x H 2 O. [Pt x Ru y ]/C. Ru/C + (CH 3 ) 2 Pt(COD). [Pt x Ru y ]/C. Nanoscale Phase Behavior.

E N D
H2 + 673 K Supported Metal Nanoparticle Metal Salt Precursor ? Pt/C + RuCl3•3H2O [PtxRuy]/C Ru/C + H2PtCl6•xH2O [PtxRuy]/C Ru/C + (CH3)2Pt(COD) [PtxRuy]/C Nanoscale Phase Behavior Characterization of final nanoparticles: X-ray Photoelectron Spectroscopy (XPS) Scanning Transmission Electron Microscopy (STEM) Energy Dispersive X-ray Analysis (EDAX) Electron Microdiffraction
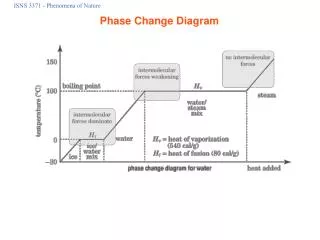
Ru3d Ru3d Pt4f Pt4f N(E)/E N(E)/E Binding Energy (eV) Binding Energy (eV) X-ray Photoelectron Spectroscopy (XPS) X-Ray Photoelectron Spectroscopy (XPS) probes the composition of the bulk sample. These figures show that bimetallic nanoparticles are formed upon reduction of a a metallic salt in the presence of supported nanoparticles (Ru or Pt).
Dark field micrograph of 10% Ru/Carbon Black (ETEK) after addition of H2PtCl6, followed by reduction. Dark field micrograph of 10% Ru/Carbon Black (ETEK). Growth of Nanoparticles after Reduction
10 % Pt/C Relative Abundance 10% Pt/C + RuCl3 Relative Abundance Particle Size (Å) Particle Size Distribution: Ru + Pt/C
Cu Ru Ru nanoparticle Pt Pt Cu carbon support Compositional Analysis: Energy Dispersive X-ray Analysis (EDAX) Relative Abundance Atomic Composition (at.% Ru) Using EDAX, the composition of individual particles is probed. The figure on the left shows sample EDAX spectra for both the carbon support and a particle of ca. 80 % Ruthenium. The figure on the right shows the representative composition distribution for all bimetallic samples.
A A B B C A A B B A C B A A Hexagonal Closest Packed (hcp) Face Centered Cubic (fcc) Atomic Ordering in Solids Adapted from: http://chemed.chem.purdue.edu/genchem/topicreview/bp/ch13/structureframe.html
111 Model XRD of Pt (fcc) 420 311 331 200 220 222 400 Model XRD of Ru (hcp) 10-11 11-22 0002 10-13 10-10 20-23 11-20 20-21 10-12 21-30 20-22 10-14 20-20 0004 Sample X-Ray Diffraction Patterns Intensity Intensity 2 (deg)
[011] [0001] [011] Electron Microdiffraction 66 Å particle with a composition of 16% Ru 35 Å particle with a composition of 66% Ru 41 Å particle with a composition of 42% Ru
Particle Size (Å) Particle Size (Å) Particle Size (Å) Atomic Composition (% Ru) Atomic Composition (% Ru) Template Effects in the Binary Phase Diagram of Pt-Ru Nanoparticles “Nano”-phase diagram of bimetallic particles formed on supported Ru clusters. “Nano”-phase diagram of bimetallic particles formed on supported Pt clusters.
Particle Size (Å) Atomic Composition (% Ru) Binary Nano-Phase Diagram • Supported bimetallic nanoparticles can be synthesized by reducing metallic salts onto pre-existing metallic nanoparticles. • XPS, EDAX, and STEM provide evidence of the formation of bimetallic particles with wide size and compositional distributions. • These bimetallic nanoparticles have an organized close-packed structure that shows phase-sensitive behavior across the compositional space. Microdiffraction results show template effects via the coexistence of both (fcc) and (hcp) structures within the same samples.